Immigrants from Sierra Leone vs Immigrants from the Azores Unemployment Among Women with Children Ages 6 to 17 years
COMPARE
Immigrants from Sierra Leone
Immigrants from the Azores
Unemployment Among Women with Children Ages 6 to 17 years
Unemployment Among Women with Children Ages 6 to 17 years Comparison
Immigrants from Sierra Leone
Immigrants from the Azores
9.0%
UNEMPLOYMENT AMONG WOMEN WITH CHILDREN AGES 6 TO 17 YEARS
45.9/ 100
METRIC RATING
175th/ 347
METRIC RANK
9.3%
UNEMPLOYMENT AMONG WOMEN WITH CHILDREN AGES 6 TO 17 YEARS
4.6/ 100
METRIC RATING
226th/ 347
METRIC RANK
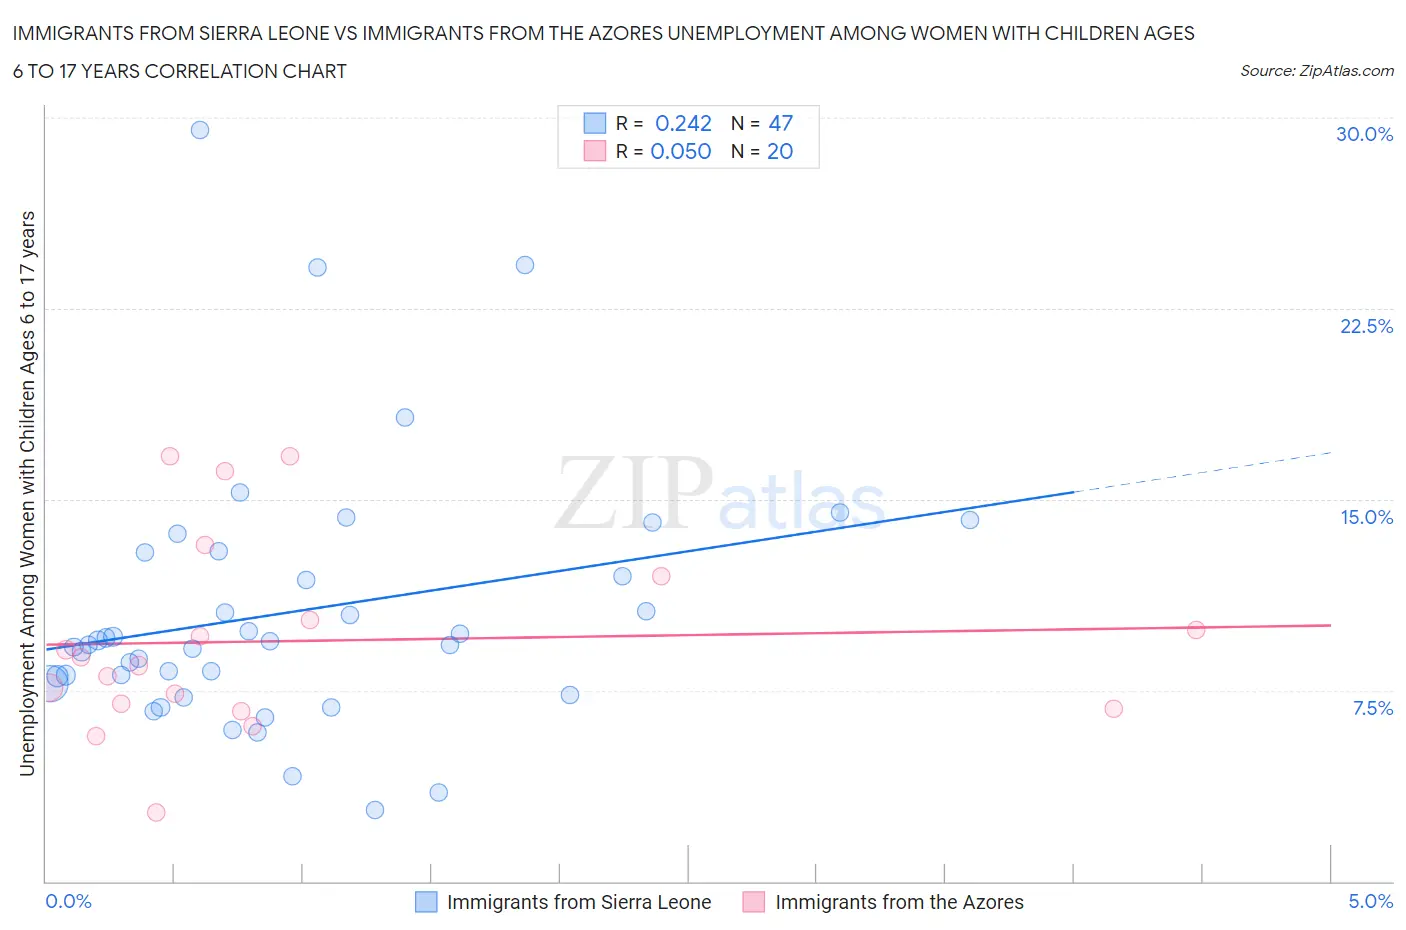
Immigrants from Sierra Leone vs Immigrants from the Azores Unemployment Among Women with Children Ages 6 to 17 years Correlation Chart
The statistical analysis conducted on geographies consisting of 90,469,077 people shows a weak positive correlation between the proportion of Immigrants from Sierra Leone and unemployment rate among women with children between the ages 6 and 17 in the United States with a correlation coefficient (R) of 0.242 and weighted average of 9.0%. Similarly, the statistical analysis conducted on geographies consisting of 39,080,392 people shows no correlation between the proportion of Immigrants from the Azores and unemployment rate among women with children between the ages 6 and 17 in the United States with a correlation coefficient (R) of 0.050 and weighted average of 9.3%, a difference of 3.2%.
Unemployment Among Women with Children Ages 6 to 17 years Correlation Summary
| Measurement | Immigrants from Sierra Leone | Immigrants from the Azores |
| Minimum | 2.8% | 2.7% |
| Maximum | 29.5% | 16.7% |
| Range | 26.7% | 14.0% |
| Mean | 10.6% | 9.4% |
| Median | 9.3% | 8.6% |
| Interquartile 25% (IQ1) | 7.7% | 6.9% |
| Interquartile 75% (IQ3) | 12.9% | 11.1% |
| Interquartile Range (IQR) | 5.2% | 4.2% |
| Standard Deviation (Sample) | 5.2% | 3.8% |
| Standard Deviation (Population) | 5.1% | 3.7% |
Similar Demographics by Unemployment Among Women with Children Ages 6 to 17 years
Demographics Similar to Immigrants from Sierra Leone by Unemployment Among Women with Children Ages 6 to 17 years
In terms of unemployment among women with children ages 6 to 17 years, the demographic groups most similar to Immigrants from Sierra Leone are Immigrants from Italy (9.0%, a difference of 0.10%), Immigrants from Costa Rica (9.0%, a difference of 0.18%), Immigrants from Jordan (9.0%, a difference of 0.20%), Immigrants from Brazil (9.0%, a difference of 0.23%), and Jordanian (9.0%, a difference of 0.28%).
| Demographics | Rating | Rank | Unemployment Among Women with Children Ages 6 to 17 years |
| Immigrants | Croatia | 57.1 /100 | #168 | Average 8.9% |
| British | 55.2 /100 | #169 | Average 8.9% |
| Turks | 54.1 /100 | #170 | Average 8.9% |
| Jordanians | 52.2 /100 | #171 | Average 9.0% |
| Immigrants | West Indies | 52.2 /100 | #172 | Average 9.0% |
| Immigrants | Brazil | 51.0 /100 | #173 | Average 9.0% |
| Immigrants | Costa Rica | 50.0 /100 | #174 | Average 9.0% |
| Immigrants | Sierra Leone | 45.9 /100 | #175 | Average 9.0% |
| Immigrants | Italy | 43.7 /100 | #176 | Average 9.0% |
| Immigrants | Jordan | 41.6 /100 | #177 | Average 9.0% |
| Menominee | 39.3 /100 | #178 | Fair 9.0% |
| Immigrants | Zaire | 38.3 /100 | #179 | Fair 9.0% |
| Ethiopians | 37.6 /100 | #180 | Fair 9.0% |
| Immigrants | Czechoslovakia | 34.5 /100 | #181 | Fair 9.0% |
| South American Indians | 34.4 /100 | #182 | Fair 9.0% |
Demographics Similar to Immigrants from the Azores by Unemployment Among Women with Children Ages 6 to 17 years
In terms of unemployment among women with children ages 6 to 17 years, the demographic groups most similar to Immigrants from the Azores are Panamanian (9.3%, a difference of 0.020%), Estonian (9.3%, a difference of 0.050%), Lumbee (9.3%, a difference of 0.080%), Chinese (9.3%, a difference of 0.14%), and Immigrants from El Salvador (9.3%, a difference of 0.15%).
| Demographics | Rating | Rank | Unemployment Among Women with Children Ages 6 to 17 years |
| Immigrants | Scotland | 6.6 /100 | #219 | Tragic 9.2% |
| Belgians | 6.4 /100 | #220 | Tragic 9.2% |
| Crow | 5.8 /100 | #221 | Tragic 9.2% |
| Immigrants | Southern Europe | 5.8 /100 | #222 | Tragic 9.2% |
| Immigrants | Eritrea | 5.8 /100 | #223 | Tragic 9.2% |
| Immigrants | El Salvador | 5.3 /100 | #224 | Tragic 9.3% |
| Chinese | 5.2 /100 | #225 | Tragic 9.3% |
| Immigrants | Azores | 4.6 /100 | #226 | Tragic 9.3% |
| Panamanians | 4.5 /100 | #227 | Tragic 9.3% |
| Estonians | 4.4 /100 | #228 | Tragic 9.3% |
| Lumbee | 4.3 /100 | #229 | Tragic 9.3% |
| Welsh | 4.0 /100 | #230 | Tragic 9.3% |
| Macedonians | 3.9 /100 | #231 | Tragic 9.3% |
| French American Indians | 3.7 /100 | #232 | Tragic 9.3% |
| Immigrants | St. Vincent and the Grenadines | 3.3 /100 | #233 | Tragic 9.3% |