Bangladeshi vs Immigrants from Eastern Europe Unemployment Among Women with Children Ages 6 to 17 years
COMPARE
Bangladeshi
Immigrants from Eastern Europe
Unemployment Among Women with Children Ages 6 to 17 years
Unemployment Among Women with Children Ages 6 to 17 years Comparison
Bangladeshis
Immigrants from Eastern Europe
7.4%
UNEMPLOYMENT AMONG WOMEN WITH CHILDREN AGES 6 TO 17 YEARS
100.0/ 100
METRIC RATING
12th/ 347
METRIC RANK
8.5%
UNEMPLOYMENT AMONG WOMEN WITH CHILDREN AGES 6 TO 17 YEARS
99.0/ 100
METRIC RATING
91st/ 347
METRIC RANK
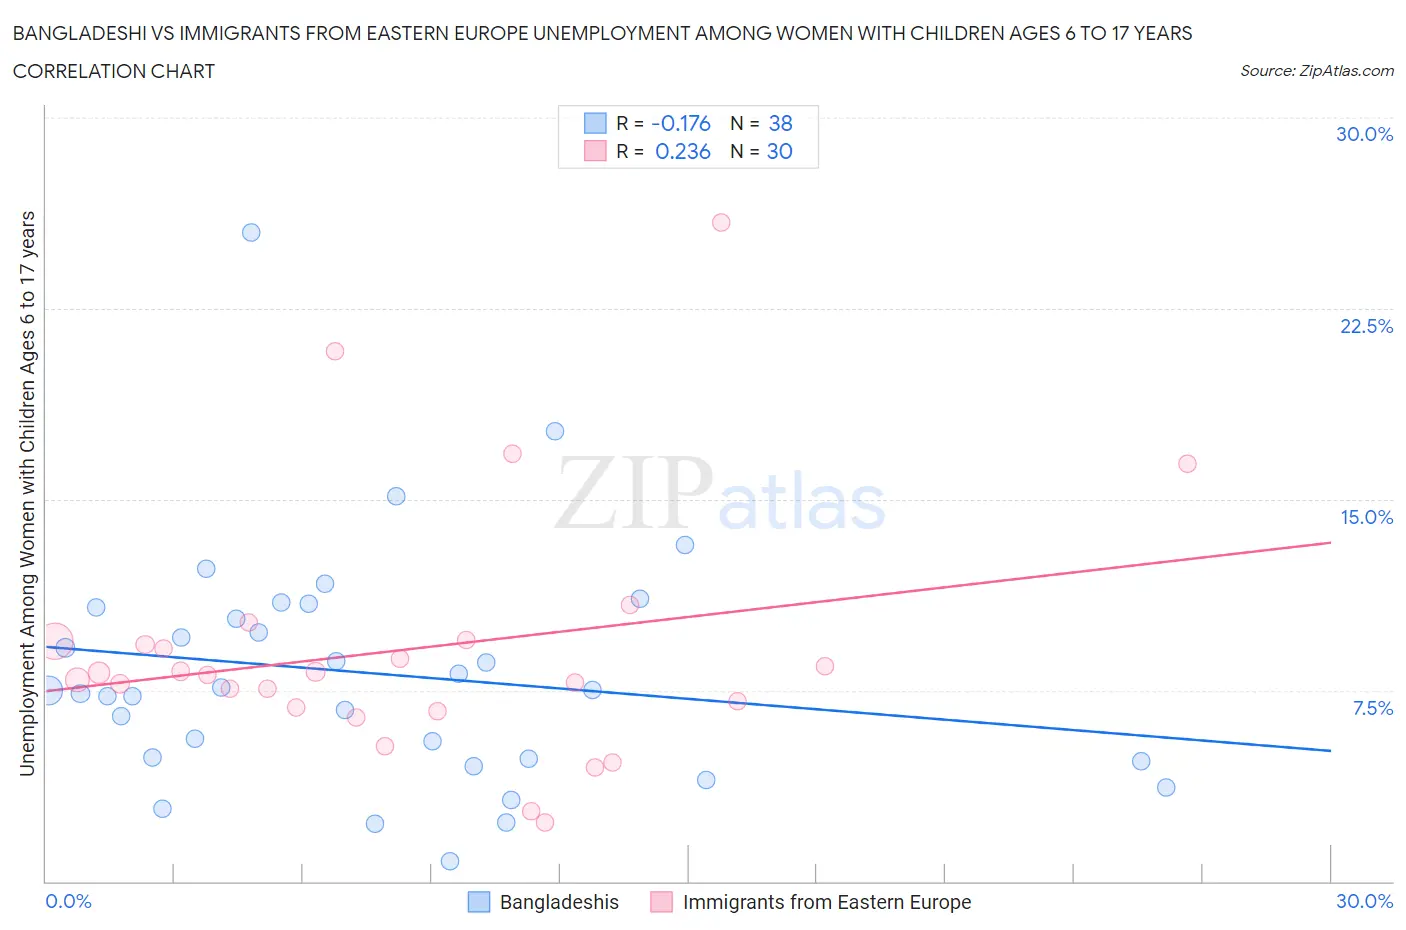
Bangladeshi vs Immigrants from Eastern Europe Unemployment Among Women with Children Ages 6 to 17 years Correlation Chart
The statistical analysis conducted on geographies consisting of 118,644,853 people shows a poor negative correlation between the proportion of Bangladeshis and unemployment rate among women with children between the ages 6 and 17 in the United States with a correlation coefficient (R) of -0.176 and weighted average of 7.4%. Similarly, the statistical analysis conducted on geographies consisting of 322,191,586 people shows a weak positive correlation between the proportion of Immigrants from Eastern Europe and unemployment rate among women with children between the ages 6 and 17 in the United States with a correlation coefficient (R) of 0.236 and weighted average of 8.5%, a difference of 15.7%.
Unemployment Among Women with Children Ages 6 to 17 years Correlation Summary
| Measurement | Bangladeshi | Immigrants from Eastern Europe |
| Minimum | 0.80% | 2.3% |
| Maximum | 25.5% | 25.9% |
| Range | 24.7% | 23.6% |
| Mean | 8.2% | 9.1% |
| Median | 7.5% | 8.2% |
| Interquartile 25% (IQ1) | 4.8% | 6.8% |
| Interquartile 75% (IQ3) | 10.8% | 9.4% |
| Interquartile Range (IQR) | 6.0% | 2.6% |
| Standard Deviation (Sample) | 4.7% | 5.0% |
| Standard Deviation (Population) | 4.6% | 4.9% |
Similar Demographics by Unemployment Among Women with Children Ages 6 to 17 years
Demographics Similar to Bangladeshis by Unemployment Among Women with Children Ages 6 to 17 years
In terms of unemployment among women with children ages 6 to 17 years, the demographic groups most similar to Bangladeshis are Immigrants from Taiwan (7.3%, a difference of 0.33%), Indonesian (7.4%, a difference of 0.71%), Sudanese (7.4%, a difference of 0.75%), Immigrants from Fiji (7.3%, a difference of 1.0%), and Puget Sound Salish (7.5%, a difference of 1.8%).
| Demographics | Rating | Rank | Unemployment Among Women with Children Ages 6 to 17 years |
| Okinawans | 100.0 /100 | #5 | Exceptional 7.0% |
| Tlingit-Haida | 100.0 /100 | #6 | Exceptional 7.1% |
| Soviet Union | 100.0 /100 | #7 | Exceptional 7.1% |
| Immigrants | Hong Kong | 100.0 /100 | #8 | Exceptional 7.2% |
| Assyrians/Chaldeans/Syriacs | 100.0 /100 | #9 | Exceptional 7.2% |
| Immigrants | Fiji | 100.0 /100 | #10 | Exceptional 7.3% |
| Immigrants | Taiwan | 100.0 /100 | #11 | Exceptional 7.3% |
| Bangladeshis | 100.0 /100 | #12 | Exceptional 7.4% |
| Indonesians | 100.0 /100 | #13 | Exceptional 7.4% |
| Sudanese | 100.0 /100 | #14 | Exceptional 7.4% |
| Puget Sound Salish | 100.0 /100 | #15 | Exceptional 7.5% |
| Immigrants | Burma/Myanmar | 100.0 /100 | #16 | Exceptional 7.5% |
| Cambodians | 100.0 /100 | #17 | Exceptional 7.5% |
| Afghans | 100.0 /100 | #18 | Exceptional 7.6% |
| Filipinos | 100.0 /100 | #19 | Exceptional 7.6% |
Demographics Similar to Immigrants from Eastern Europe by Unemployment Among Women with Children Ages 6 to 17 years
In terms of unemployment among women with children ages 6 to 17 years, the demographic groups most similar to Immigrants from Eastern Europe are Potawatomi (8.5%, a difference of 0.030%), Yugoslavian (8.5%, a difference of 0.060%), Paiute (8.5%, a difference of 0.10%), Australian (8.5%, a difference of 0.14%), and Immigrants from Vietnam (8.5%, a difference of 0.18%).
| Demographics | Rating | Rank | Unemployment Among Women with Children Ages 6 to 17 years |
| Japanese | 99.5 /100 | #84 | Exceptional 8.4% |
| Immigrants | North Macedonia | 99.4 /100 | #85 | Exceptional 8.5% |
| Alaskan Athabascans | 99.4 /100 | #86 | Exceptional 8.5% |
| Immigrants | Israel | 99.1 /100 | #87 | Exceptional 8.5% |
| Immigrants | Vietnam | 99.1 /100 | #88 | Exceptional 8.5% |
| Paiute | 99.1 /100 | #89 | Exceptional 8.5% |
| Yugoslavians | 99.0 /100 | #90 | Exceptional 8.5% |
| Immigrants | Eastern Europe | 99.0 /100 | #91 | Exceptional 8.5% |
| Potawatomi | 99.0 /100 | #92 | Exceptional 8.5% |
| Australians | 98.9 /100 | #93 | Exceptional 8.5% |
| Immigrants | Barbados | 98.8 /100 | #94 | Exceptional 8.5% |
| Sri Lankans | 98.7 /100 | #95 | Exceptional 8.5% |
| German Russians | 98.6 /100 | #96 | Exceptional 8.5% |
| Bolivians | 98.5 /100 | #97 | Exceptional 8.5% |
| Malaysians | 98.5 /100 | #98 | Exceptional 8.6% |