Bangladeshi vs Immigrants from Chile Unemployment Among Women with Children Ages 6 to 17 years
COMPARE
Bangladeshi
Immigrants from Chile
Unemployment Among Women with Children Ages 6 to 17 years
Unemployment Among Women with Children Ages 6 to 17 years Comparison
Bangladeshis
Immigrants from Chile
7.4%
UNEMPLOYMENT AMONG WOMEN WITH CHILDREN AGES 6 TO 17 YEARS
100.0/ 100
METRIC RATING
12th/ 347
METRIC RANK
8.9%
UNEMPLOYMENT AMONG WOMEN WITH CHILDREN AGES 6 TO 17 YEARS
65.3/ 100
METRIC RATING
158th/ 347
METRIC RANK
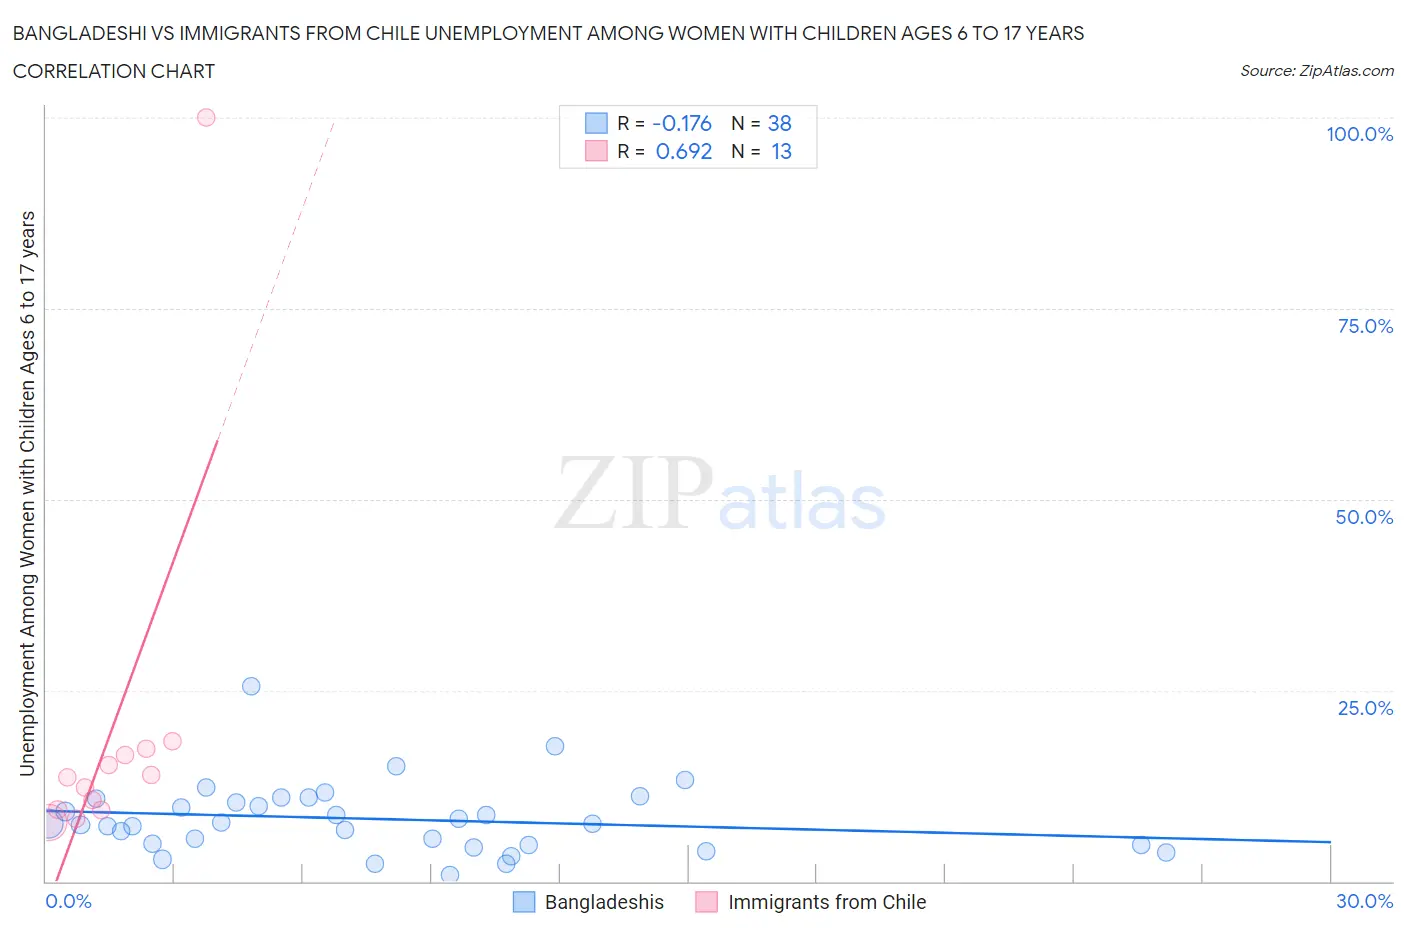
Bangladeshi vs Immigrants from Chile Unemployment Among Women with Children Ages 6 to 17 years Correlation Chart
The statistical analysis conducted on geographies consisting of 118,644,853 people shows a poor negative correlation between the proportion of Bangladeshis and unemployment rate among women with children between the ages 6 and 17 in the United States with a correlation coefficient (R) of -0.176 and weighted average of 7.4%. Similarly, the statistical analysis conducted on geographies consisting of 175,273,874 people shows a significant positive correlation between the proportion of Immigrants from Chile and unemployment rate among women with children between the ages 6 and 17 in the United States with a correlation coefficient (R) of 0.692 and weighted average of 8.9%, a difference of 21.0%.
Unemployment Among Women with Children Ages 6 to 17 years Correlation Summary
| Measurement | Bangladeshi | Immigrants from Chile |
| Minimum | 0.80% | 7.8% |
| Maximum | 25.5% | 100.0% |
| Range | 24.7% | 92.2% |
| Mean | 8.2% | 19.4% |
| Median | 7.5% | 13.5% |
| Interquartile 25% (IQ1) | 4.8% | 9.3% |
| Interquartile 75% (IQ3) | 10.8% | 17.0% |
| Interquartile Range (IQR) | 6.0% | 7.7% |
| Standard Deviation (Sample) | 4.7% | 24.5% |
| Standard Deviation (Population) | 4.6% | 23.5% |
Similar Demographics by Unemployment Among Women with Children Ages 6 to 17 years
Demographics Similar to Bangladeshis by Unemployment Among Women with Children Ages 6 to 17 years
In terms of unemployment among women with children ages 6 to 17 years, the demographic groups most similar to Bangladeshis are Immigrants from Taiwan (7.3%, a difference of 0.33%), Indonesian (7.4%, a difference of 0.71%), Sudanese (7.4%, a difference of 0.75%), Immigrants from Fiji (7.3%, a difference of 1.0%), and Puget Sound Salish (7.5%, a difference of 1.8%).
| Demographics | Rating | Rank | Unemployment Among Women with Children Ages 6 to 17 years |
| Okinawans | 100.0 /100 | #5 | Exceptional 7.0% |
| Tlingit-Haida | 100.0 /100 | #6 | Exceptional 7.1% |
| Soviet Union | 100.0 /100 | #7 | Exceptional 7.1% |
| Immigrants | Hong Kong | 100.0 /100 | #8 | Exceptional 7.2% |
| Assyrians/Chaldeans/Syriacs | 100.0 /100 | #9 | Exceptional 7.2% |
| Immigrants | Fiji | 100.0 /100 | #10 | Exceptional 7.3% |
| Immigrants | Taiwan | 100.0 /100 | #11 | Exceptional 7.3% |
| Bangladeshis | 100.0 /100 | #12 | Exceptional 7.4% |
| Indonesians | 100.0 /100 | #13 | Exceptional 7.4% |
| Sudanese | 100.0 /100 | #14 | Exceptional 7.4% |
| Puget Sound Salish | 100.0 /100 | #15 | Exceptional 7.5% |
| Immigrants | Burma/Myanmar | 100.0 /100 | #16 | Exceptional 7.5% |
| Cambodians | 100.0 /100 | #17 | Exceptional 7.5% |
| Afghans | 100.0 /100 | #18 | Exceptional 7.6% |
| Filipinos | 100.0 /100 | #19 | Exceptional 7.6% |
Demographics Similar to Immigrants from Chile by Unemployment Among Women with Children Ages 6 to 17 years
In terms of unemployment among women with children ages 6 to 17 years, the demographic groups most similar to Immigrants from Chile are Immigrants from Belgium (8.9%, a difference of 0.010%), Osage (8.9%, a difference of 0.030%), Spanish (8.9%, a difference of 0.070%), Immigrants from Hungary (8.9%, a difference of 0.090%), and Immigrants from Guyana (8.9%, a difference of 0.12%).
| Demographics | Rating | Rank | Unemployment Among Women with Children Ages 6 to 17 years |
| Immigrants | Eastern Africa | 74.6 /100 | #151 | Good 8.9% |
| Immigrants | Northern Europe | 74.6 /100 | #152 | Good 8.9% |
| Immigrants | Europe | 73.4 /100 | #153 | Good 8.9% |
| Vietnamese | 72.1 /100 | #154 | Good 8.9% |
| Immigrants | Greece | 71.8 /100 | #155 | Good 8.9% |
| Osage | 65.9 /100 | #156 | Good 8.9% |
| Immigrants | Belgium | 65.6 /100 | #157 | Good 8.9% |
| Immigrants | Chile | 65.3 /100 | #158 | Good 8.9% |
| Spanish | 63.8 /100 | #159 | Good 8.9% |
| Immigrants | Hungary | 63.4 /100 | #160 | Good 8.9% |
| Immigrants | Guyana | 63.0 /100 | #161 | Good 8.9% |
| Immigrants | Netherlands | 60.8 /100 | #162 | Good 8.9% |
| Mexican American Indians | 60.6 /100 | #163 | Good 8.9% |
| Ukrainians | 59.7 /100 | #164 | Average 8.9% |
| Immigrants | Micronesia | 59.2 /100 | #165 | Average 8.9% |