Yakama vs Indian (Asian) Male Unemployment
COMPARE
Yakama
Indian (Asian)
Male Unemployment
Male Unemployment Comparison
Yakama
Indians (Asian)
7.9%
MALE UNEMPLOYMENT
0.0/ 100
METRIC RATING
330th/ 347
METRIC RANK
5.2%
MALE UNEMPLOYMENT
76.0/ 100
METRIC RATING
150th/ 347
METRIC RANK
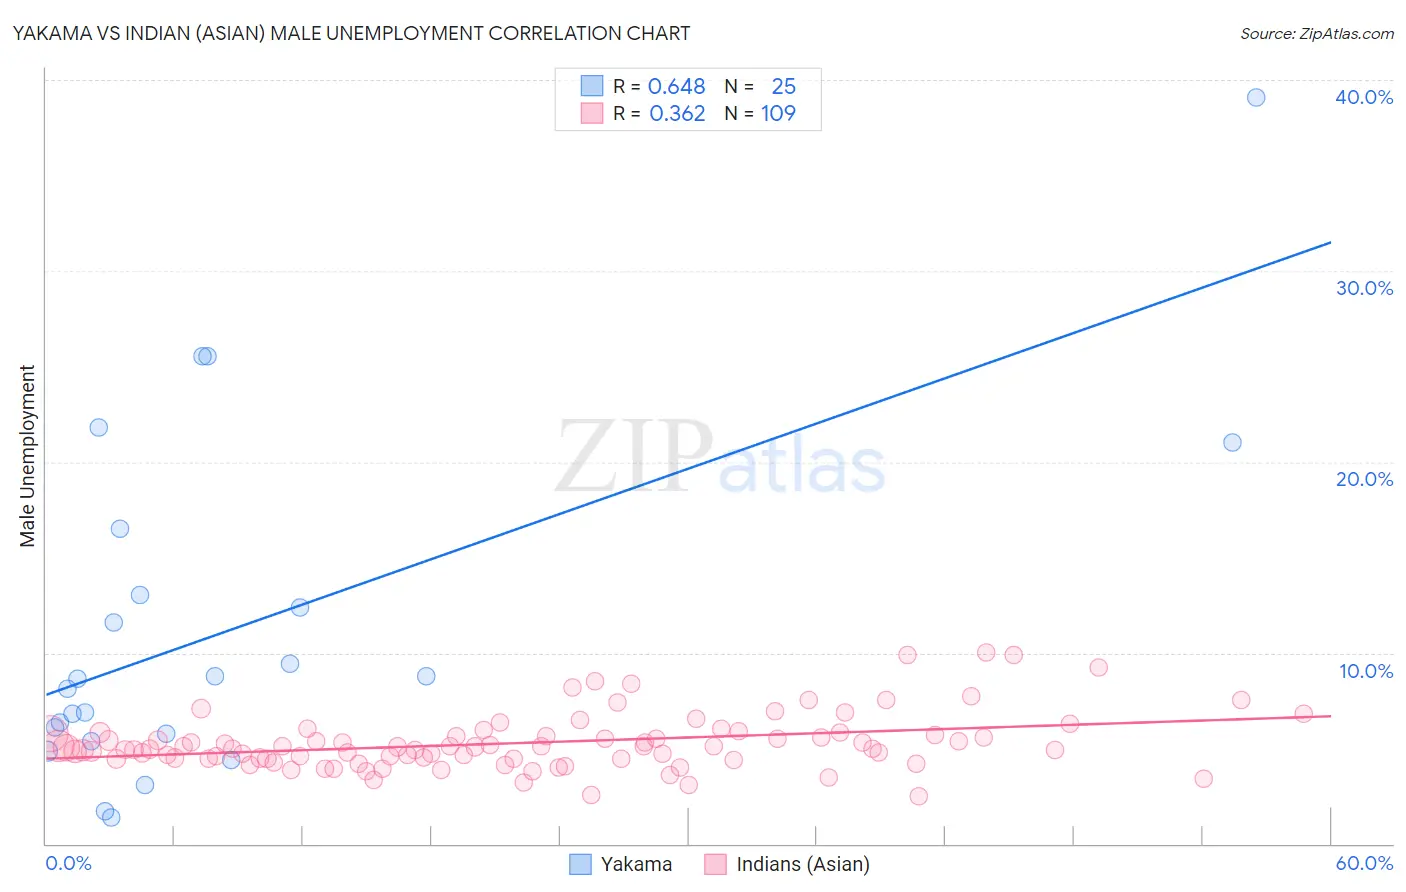
Yakama vs Indian (Asian) Male Unemployment Correlation Chart
The statistical analysis conducted on geographies consisting of 19,892,932 people shows a significant positive correlation between the proportion of Yakama and unemployment rate among males in the United States with a correlation coefficient (R) of 0.648 and weighted average of 7.9%. Similarly, the statistical analysis conducted on geographies consisting of 491,822,347 people shows a mild positive correlation between the proportion of Indians (Asian) and unemployment rate among males in the United States with a correlation coefficient (R) of 0.362 and weighted average of 5.2%, a difference of 52.3%.
Male Unemployment Correlation Summary
| Measurement | Yakama | Indian (Asian) |
| Minimum | 1.4% | 2.5% |
| Maximum | 39.1% | 10.0% |
| Range | 37.7% | 7.5% |
| Mean | 11.3% | 5.3% |
| Median | 8.7% | 5.0% |
| Interquartile 25% (IQ1) | 5.5% | 4.4% |
| Interquartile 75% (IQ3) | 14.7% | 5.7% |
| Interquartile Range (IQR) | 9.2% | 1.3% |
| Standard Deviation (Sample) | 9.0% | 1.5% |
| Standard Deviation (Population) | 8.8% | 1.4% |
Similar Demographics by Male Unemployment
Demographics Similar to Yakama by Male Unemployment
In terms of male unemployment, the demographic groups most similar to Yakama are Immigrants from Yemen (7.8%, a difference of 1.8%), Alaska Native (8.1%, a difference of 1.9%), Native/Alaskan (7.7%, a difference of 2.7%), Paiute (7.7%, a difference of 3.1%), and Immigrants from Dominican Republic (7.6%, a difference of 4.2%).
| Demographics | Rating | Rank | Male Unemployment |
| Immigrants | Grenada | 0.0 /100 | #323 | Tragic 7.6% |
| Dominicans | 0.0 /100 | #324 | Tragic 7.6% |
| Shoshone | 0.0 /100 | #325 | Tragic 7.6% |
| Immigrants | Dominican Republic | 0.0 /100 | #326 | Tragic 7.6% |
| Paiute | 0.0 /100 | #327 | Tragic 7.7% |
| Natives/Alaskans | 0.0 /100 | #328 | Tragic 7.7% |
| Immigrants | Yemen | 0.0 /100 | #329 | Tragic 7.8% |
| Yakama | 0.0 /100 | #330 | Tragic 7.9% |
| Alaska Natives | 0.0 /100 | #331 | Tragic 8.1% |
| Pima | 0.0 /100 | #332 | Tragic 8.3% |
| Sioux | 0.0 /100 | #333 | Tragic 8.4% |
| Tsimshian | 0.0 /100 | #334 | Tragic 8.5% |
| Pueblo | 0.0 /100 | #335 | Tragic 8.5% |
| Yuman | 0.0 /100 | #336 | Tragic 8.6% |
| Puerto Ricans | 0.0 /100 | #337 | Tragic 8.6% |
Demographics Similar to Indians (Asian) by Male Unemployment
In terms of male unemployment, the demographic groups most similar to Indians (Asian) are Immigrants from Europe (5.2%, a difference of 0.020%), Immigrants from Italy (5.2%, a difference of 0.030%), Slovak (5.2%, a difference of 0.040%), Egyptian (5.2%, a difference of 0.090%), and Immigrants from Burma/Myanmar (5.2%, a difference of 0.12%).
| Demographics | Rating | Rank | Male Unemployment |
| Syrians | 78.0 /100 | #143 | Good 5.2% |
| Sri Lankans | 77.9 /100 | #144 | Good 5.2% |
| Macedonians | 77.7 /100 | #145 | Good 5.2% |
| Immigrants | Kenya | 77.6 /100 | #146 | Good 5.2% |
| Immigrants | Burma/Myanmar | 77.5 /100 | #147 | Good 5.2% |
| Immigrants | Italy | 76.3 /100 | #148 | Good 5.2% |
| Immigrants | Europe | 76.2 /100 | #149 | Good 5.2% |
| Indians (Asian) | 76.0 /100 | #150 | Good 5.2% |
| Slovaks | 75.5 /100 | #151 | Good 5.2% |
| Egyptians | 74.8 /100 | #152 | Good 5.2% |
| Immigrants | Uruguay | 73.9 /100 | #153 | Good 5.2% |
| Laotians | 73.8 /100 | #154 | Good 5.2% |
| Immigrants | Hungary | 73.4 /100 | #155 | Good 5.2% |
| Americans | 72.7 /100 | #156 | Good 5.2% |
| Immigrants | Northern Africa | 72.3 /100 | #157 | Good 5.2% |