Immigrants from Serbia vs Indian (Asian) Male Unemployment
COMPARE
Immigrants from Serbia
Indian (Asian)
Male Unemployment
Male Unemployment Comparison
Immigrants from Serbia
Indians (Asian)
5.1%
MALE UNEMPLOYMENT
94.2/ 100
METRIC RATING
93rd/ 347
METRIC RANK
5.2%
MALE UNEMPLOYMENT
76.0/ 100
METRIC RATING
150th/ 347
METRIC RANK
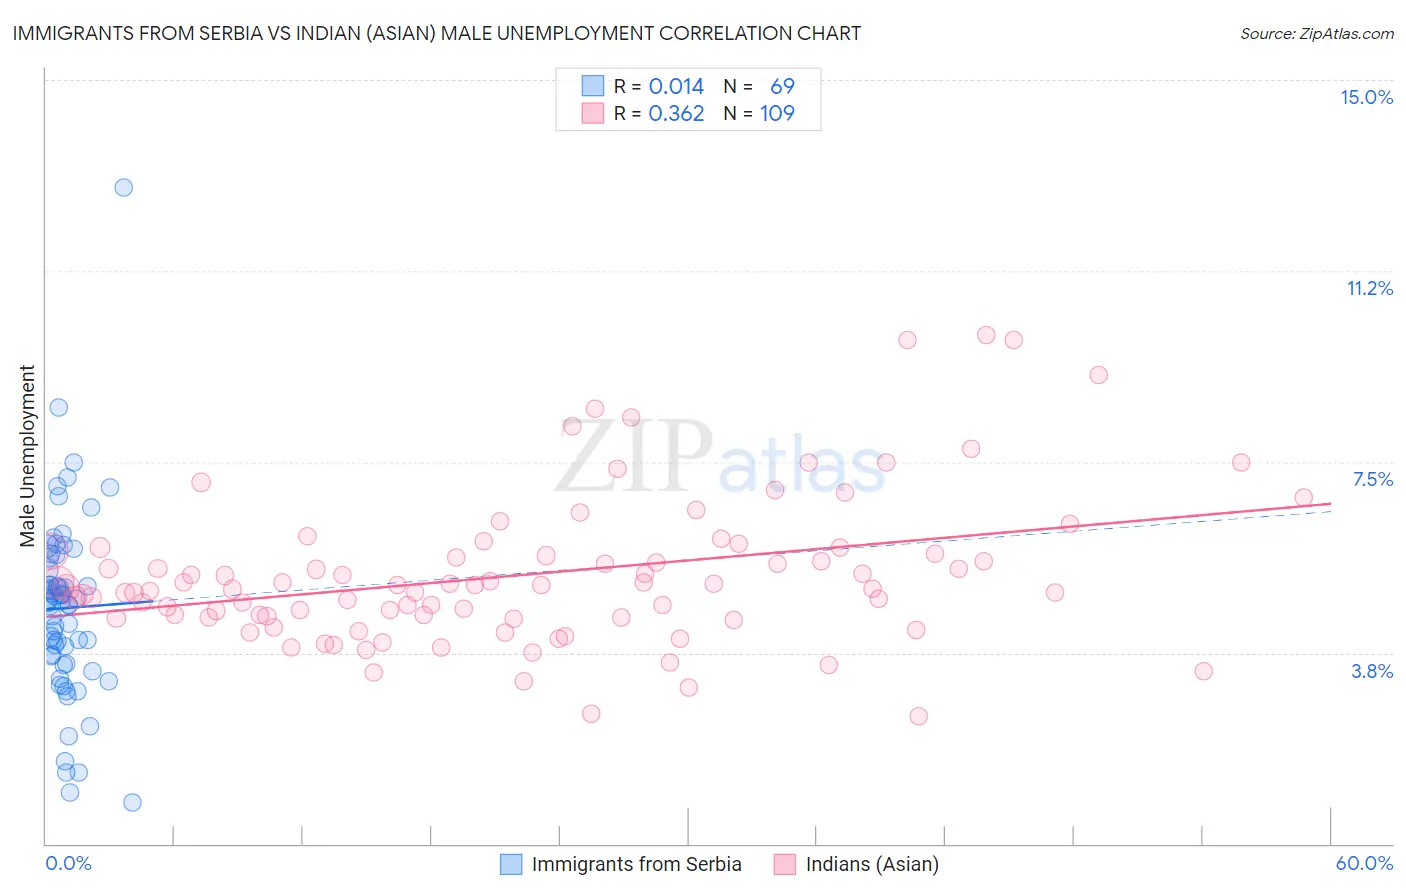
Immigrants from Serbia vs Indian (Asian) Male Unemployment Correlation Chart
The statistical analysis conducted on geographies consisting of 131,612,227 people shows no correlation between the proportion of Immigrants from Serbia and unemployment rate among males in the United States with a correlation coefficient (R) of 0.014 and weighted average of 5.1%. Similarly, the statistical analysis conducted on geographies consisting of 491,822,347 people shows a mild positive correlation between the proportion of Indians (Asian) and unemployment rate among males in the United States with a correlation coefficient (R) of 0.362 and weighted average of 5.2%, a difference of 2.5%.
Male Unemployment Correlation Summary
| Measurement | Immigrants from Serbia | Indian (Asian) |
| Minimum | 0.80% | 2.5% |
| Maximum | 12.9% | 10.0% |
| Range | 12.1% | 7.5% |
| Mean | 4.6% | 5.3% |
| Median | 4.8% | 5.0% |
| Interquartile 25% (IQ1) | 3.6% | 4.4% |
| Interquartile 75% (IQ3) | 5.5% | 5.7% |
| Interquartile Range (IQR) | 1.9% | 1.3% |
| Standard Deviation (Sample) | 1.8% | 1.5% |
| Standard Deviation (Population) | 1.8% | 1.4% |
Similar Demographics by Male Unemployment
Demographics Similar to Immigrants from Serbia by Male Unemployment
In terms of male unemployment, the demographic groups most similar to Immigrants from Serbia are Slavic (5.1%, a difference of 0.0%), Canadian (5.1%, a difference of 0.050%), Immigrants from Turkey (5.1%, a difference of 0.060%), Italian (5.1%, a difference of 0.12%), and Okinawan (5.1%, a difference of 0.14%).
| Demographics | Rating | Rank | Male Unemployment |
| Maltese | 95.5 /100 | #86 | Exceptional 5.1% |
| Immigrants | Romania | 95.4 /100 | #87 | Exceptional 5.1% |
| Immigrants | Sri Lanka | 94.9 /100 | #88 | Exceptional 5.1% |
| Immigrants | Australia | 94.7 /100 | #89 | Exceptional 5.1% |
| Okinawans | 94.7 /100 | #90 | Exceptional 5.1% |
| Immigrants | Turkey | 94.4 /100 | #91 | Exceptional 5.1% |
| Slavs | 94.2 /100 | #92 | Exceptional 5.1% |
| Immigrants | Serbia | 94.2 /100 | #93 | Exceptional 5.1% |
| Canadians | 94.1 /100 | #94 | Exceptional 5.1% |
| Italians | 93.8 /100 | #95 | Exceptional 5.1% |
| Asians | 93.7 /100 | #96 | Exceptional 5.1% |
| Immigrants | Spain | 93.4 /100 | #97 | Exceptional 5.1% |
| Immigrants | Kuwait | 93.3 /100 | #98 | Exceptional 5.1% |
| Uruguayans | 93.0 /100 | #99 | Exceptional 5.1% |
| Russians | 92.9 /100 | #100 | Exceptional 5.1% |
Demographics Similar to Indians (Asian) by Male Unemployment
In terms of male unemployment, the demographic groups most similar to Indians (Asian) are Immigrants from Europe (5.2%, a difference of 0.020%), Immigrants from Italy (5.2%, a difference of 0.030%), Slovak (5.2%, a difference of 0.040%), Egyptian (5.2%, a difference of 0.090%), and Immigrants from Burma/Myanmar (5.2%, a difference of 0.12%).
| Demographics | Rating | Rank | Male Unemployment |
| Syrians | 78.0 /100 | #143 | Good 5.2% |
| Sri Lankans | 77.9 /100 | #144 | Good 5.2% |
| Macedonians | 77.7 /100 | #145 | Good 5.2% |
| Immigrants | Kenya | 77.6 /100 | #146 | Good 5.2% |
| Immigrants | Burma/Myanmar | 77.5 /100 | #147 | Good 5.2% |
| Immigrants | Italy | 76.3 /100 | #148 | Good 5.2% |
| Immigrants | Europe | 76.2 /100 | #149 | Good 5.2% |
| Indians (Asian) | 76.0 /100 | #150 | Good 5.2% |
| Slovaks | 75.5 /100 | #151 | Good 5.2% |
| Egyptians | 74.8 /100 | #152 | Good 5.2% |
| Immigrants | Uruguay | 73.9 /100 | #153 | Good 5.2% |
| Laotians | 73.8 /100 | #154 | Good 5.2% |
| Immigrants | Hungary | 73.4 /100 | #155 | Good 5.2% |
| Americans | 72.7 /100 | #156 | Good 5.2% |
| Immigrants | Northern Africa | 72.3 /100 | #157 | Good 5.2% |