Immigrants from Senegal vs Indian (Asian) Male Unemployment
COMPARE
Immigrants from Senegal
Indian (Asian)
Male Unemployment
Male Unemployment Comparison
Immigrants from Senegal
Indians (Asian)
6.3%
MALE UNEMPLOYMENT
0.0/ 100
METRIC RATING
288th/ 347
METRIC RANK
5.2%
MALE UNEMPLOYMENT
76.0/ 100
METRIC RATING
150th/ 347
METRIC RANK
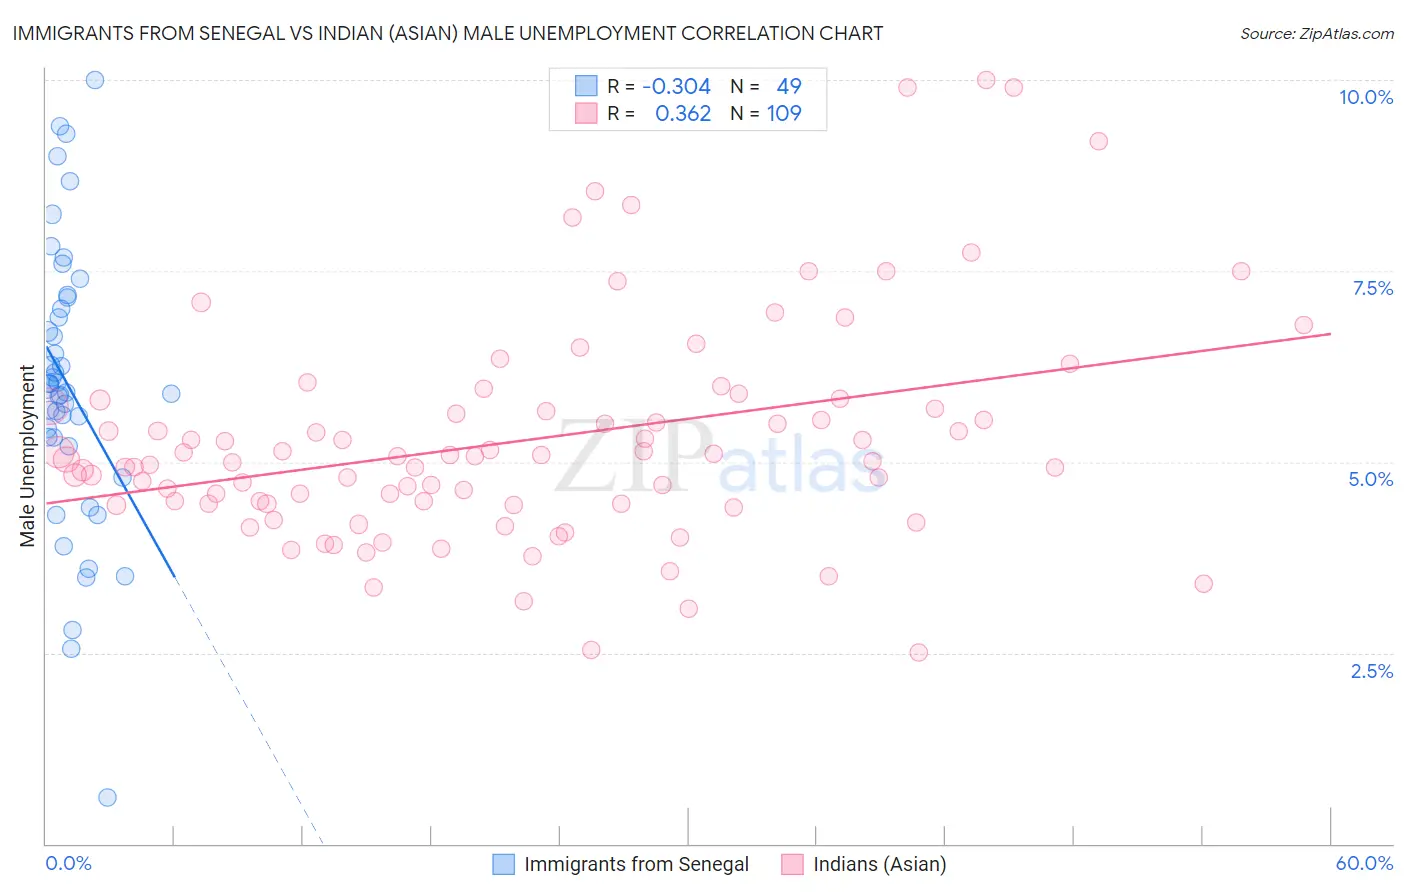
Immigrants from Senegal vs Indian (Asian) Male Unemployment Correlation Chart
The statistical analysis conducted on geographies consisting of 90,058,002 people shows a mild negative correlation between the proportion of Immigrants from Senegal and unemployment rate among males in the United States with a correlation coefficient (R) of -0.304 and weighted average of 6.3%. Similarly, the statistical analysis conducted on geographies consisting of 491,822,347 people shows a mild positive correlation between the proportion of Indians (Asian) and unemployment rate among males in the United States with a correlation coefficient (R) of 0.362 and weighted average of 5.2%, a difference of 20.6%.
Male Unemployment Correlation Summary
| Measurement | Immigrants from Senegal | Indian (Asian) |
| Minimum | 0.60% | 2.5% |
| Maximum | 10.0% | 10.0% |
| Range | 9.4% | 7.5% |
| Mean | 6.0% | 5.3% |
| Median | 6.0% | 5.0% |
| Interquartile 25% (IQ1) | 5.3% | 4.4% |
| Interquartile 75% (IQ3) | 7.1% | 5.7% |
| Interquartile Range (IQR) | 1.8% | 1.3% |
| Standard Deviation (Sample) | 1.8% | 1.5% |
| Standard Deviation (Population) | 1.8% | 1.4% |
Similar Demographics by Male Unemployment
Demographics Similar to Immigrants from Senegal by Male Unemployment
In terms of male unemployment, the demographic groups most similar to Immigrants from Senegal are Central American Indian (6.3%, a difference of 0.040%), Immigrants from Caribbean (6.3%, a difference of 0.12%), African (6.3%, a difference of 0.33%), Immigrants from Ecuador (6.2%, a difference of 0.76%), and Spanish American Indian (6.2%, a difference of 0.78%).
| Demographics | Rating | Rank | Male Unemployment |
| Sierra Leoneans | 0.0 /100 | #281 | Tragic 6.2% |
| Ecuadorians | 0.0 /100 | #282 | Tragic 6.2% |
| Immigrants | Western Africa | 0.0 /100 | #283 | Tragic 6.2% |
| Spanish American Indians | 0.0 /100 | #284 | Tragic 6.2% |
| Immigrants | Ecuador | 0.0 /100 | #285 | Tragic 6.2% |
| Africans | 0.0 /100 | #286 | Tragic 6.3% |
| Central American Indians | 0.0 /100 | #287 | Tragic 6.3% |
| Immigrants | Senegal | 0.0 /100 | #288 | Tragic 6.3% |
| Immigrants | Caribbean | 0.0 /100 | #289 | Tragic 6.3% |
| U.S. Virgin Islanders | 0.0 /100 | #290 | Tragic 6.4% |
| Immigrants | Azores | 0.0 /100 | #291 | Tragic 6.4% |
| Nepalese | 0.0 /100 | #292 | Tragic 6.4% |
| Haitians | 0.0 /100 | #293 | Tragic 6.4% |
| Senegalese | 0.0 /100 | #294 | Tragic 6.4% |
| Belizeans | 0.0 /100 | #295 | Tragic 6.5% |
Demographics Similar to Indians (Asian) by Male Unemployment
In terms of male unemployment, the demographic groups most similar to Indians (Asian) are Immigrants from Europe (5.2%, a difference of 0.020%), Immigrants from Italy (5.2%, a difference of 0.030%), Slovak (5.2%, a difference of 0.040%), Egyptian (5.2%, a difference of 0.090%), and Immigrants from Burma/Myanmar (5.2%, a difference of 0.12%).
| Demographics | Rating | Rank | Male Unemployment |
| Syrians | 78.0 /100 | #143 | Good 5.2% |
| Sri Lankans | 77.9 /100 | #144 | Good 5.2% |
| Macedonians | 77.7 /100 | #145 | Good 5.2% |
| Immigrants | Kenya | 77.6 /100 | #146 | Good 5.2% |
| Immigrants | Burma/Myanmar | 77.5 /100 | #147 | Good 5.2% |
| Immigrants | Italy | 76.3 /100 | #148 | Good 5.2% |
| Immigrants | Europe | 76.2 /100 | #149 | Good 5.2% |
| Indians (Asian) | 76.0 /100 | #150 | Good 5.2% |
| Slovaks | 75.5 /100 | #151 | Good 5.2% |
| Egyptians | 74.8 /100 | #152 | Good 5.2% |
| Immigrants | Uruguay | 73.9 /100 | #153 | Good 5.2% |
| Laotians | 73.8 /100 | #154 | Good 5.2% |
| Immigrants | Hungary | 73.4 /100 | #155 | Good 5.2% |
| Americans | 72.7 /100 | #156 | Good 5.2% |
| Immigrants | Northern Africa | 72.3 /100 | #157 | Good 5.2% |