Albanian vs Indian (Asian) Male Unemployment
COMPARE
Albanian
Indian (Asian)
Male Unemployment
Male Unemployment Comparison
Albanians
Indians (Asian)
5.4%
MALE UNEMPLOYMENT
17.3/ 100
METRIC RATING
196th/ 347
METRIC RANK
5.2%
MALE UNEMPLOYMENT
76.0/ 100
METRIC RATING
150th/ 347
METRIC RANK
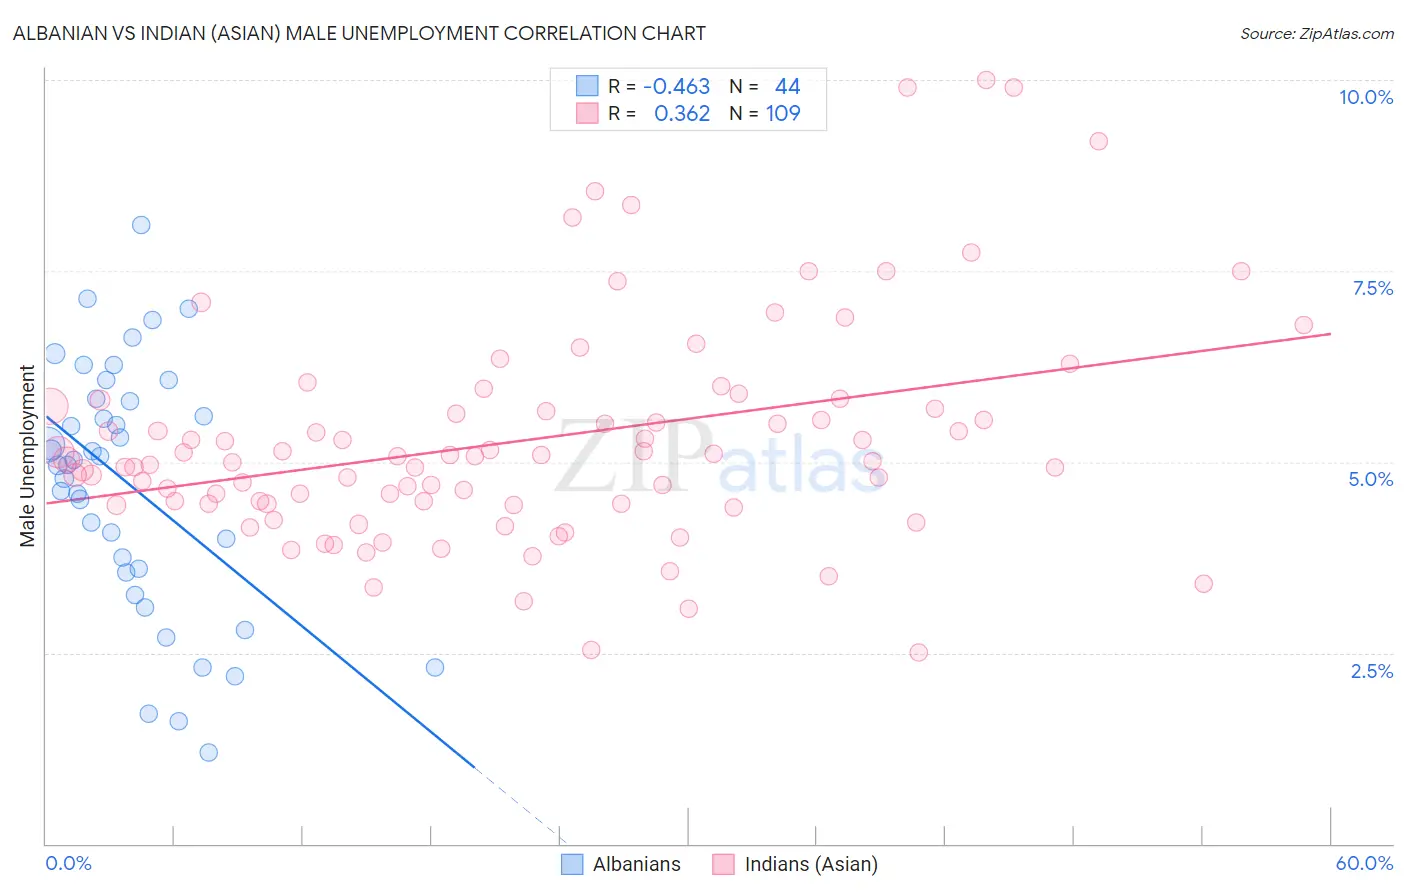
Albanian vs Indian (Asian) Male Unemployment Correlation Chart
The statistical analysis conducted on geographies consisting of 192,976,044 people shows a moderate negative correlation between the proportion of Albanians and unemployment rate among males in the United States with a correlation coefficient (R) of -0.463 and weighted average of 5.4%. Similarly, the statistical analysis conducted on geographies consisting of 491,822,347 people shows a mild positive correlation between the proportion of Indians (Asian) and unemployment rate among males in the United States with a correlation coefficient (R) of 0.362 and weighted average of 5.2%, a difference of 4.0%.
Male Unemployment Correlation Summary
| Measurement | Albanian | Indian (Asian) |
| Minimum | 1.2% | 2.5% |
| Maximum | 8.1% | 10.0% |
| Range | 6.9% | 7.5% |
| Mean | 4.7% | 5.3% |
| Median | 5.0% | 5.0% |
| Interquartile 25% (IQ1) | 3.6% | 4.4% |
| Interquartile 75% (IQ3) | 5.8% | 5.7% |
| Interquartile Range (IQR) | 2.2% | 1.3% |
| Standard Deviation (Sample) | 1.6% | 1.5% |
| Standard Deviation (Population) | 1.6% | 1.4% |
Similar Demographics by Male Unemployment
Demographics Similar to Albanians by Male Unemployment
In terms of male unemployment, the demographic groups most similar to Albanians are Immigrants from Southern Europe (5.4%, a difference of 0.040%), Alsatian (5.4%, a difference of 0.060%), Spanish (5.4%, a difference of 0.22%), Immigrants from Thailand (5.4%, a difference of 0.28%), and Immigrants from Greece (5.4%, a difference of 0.30%).
| Demographics | Rating | Rank | Male Unemployment |
| Immigrants | South America | 29.4 /100 | #189 | Fair 5.4% |
| Immigrants | Uganda | 28.8 /100 | #190 | Fair 5.4% |
| Immigrants | South Eastern Asia | 28.2 /100 | #191 | Fair 5.4% |
| Immigrants | Belarus | 26.0 /100 | #192 | Fair 5.4% |
| Immigrants | Israel | 25.2 /100 | #193 | Fair 5.4% |
| Spanish | 19.7 /100 | #194 | Poor 5.4% |
| Immigrants | Southern Europe | 17.7 /100 | #195 | Poor 5.4% |
| Albanians | 17.3 /100 | #196 | Poor 5.4% |
| Alsatians | 16.7 /100 | #197 | Poor 5.4% |
| Immigrants | Thailand | 14.7 /100 | #198 | Poor 5.4% |
| Immigrants | Greece | 14.5 /100 | #199 | Poor 5.4% |
| Immigrants | Zaire | 13.7 /100 | #200 | Poor 5.4% |
| Immigrants | Philippines | 13.5 /100 | #201 | Poor 5.4% |
| Immigrants | Nonimmigrants | 13.1 /100 | #202 | Poor 5.4% |
| Immigrants | Laos | 13.0 /100 | #203 | Poor 5.4% |
Demographics Similar to Indians (Asian) by Male Unemployment
In terms of male unemployment, the demographic groups most similar to Indians (Asian) are Immigrants from Europe (5.2%, a difference of 0.020%), Immigrants from Italy (5.2%, a difference of 0.030%), Slovak (5.2%, a difference of 0.040%), Egyptian (5.2%, a difference of 0.090%), and Immigrants from Burma/Myanmar (5.2%, a difference of 0.12%).
| Demographics | Rating | Rank | Male Unemployment |
| Syrians | 78.0 /100 | #143 | Good 5.2% |
| Sri Lankans | 77.9 /100 | #144 | Good 5.2% |
| Macedonians | 77.7 /100 | #145 | Good 5.2% |
| Immigrants | Kenya | 77.6 /100 | #146 | Good 5.2% |
| Immigrants | Burma/Myanmar | 77.5 /100 | #147 | Good 5.2% |
| Immigrants | Italy | 76.3 /100 | #148 | Good 5.2% |
| Immigrants | Europe | 76.2 /100 | #149 | Good 5.2% |
| Indians (Asian) | 76.0 /100 | #150 | Good 5.2% |
| Slovaks | 75.5 /100 | #151 | Good 5.2% |
| Egyptians | 74.8 /100 | #152 | Good 5.2% |
| Immigrants | Uruguay | 73.9 /100 | #153 | Good 5.2% |
| Laotians | 73.8 /100 | #154 | Good 5.2% |
| Immigrants | Hungary | 73.4 /100 | #155 | Good 5.2% |
| Americans | 72.7 /100 | #156 | Good 5.2% |
| Immigrants | Northern Africa | 72.3 /100 | #157 | Good 5.2% |