Assyrian/Chaldean/Syriac vs Immigrants from Germany Unemployment
COMPARE
Assyrian/Chaldean/Syriac
Immigrants from Germany
Unemployment
Unemployment Comparison
Assyrians/Chaldeans/Syriacs
Immigrants from Germany
5.3%
UNEMPLOYMENT
39.2/ 100
METRIC RATING
184th/ 347
METRIC RANK
5.1%
UNEMPLOYMENT
90.8/ 100
METRIC RATING
118th/ 347
METRIC RANK
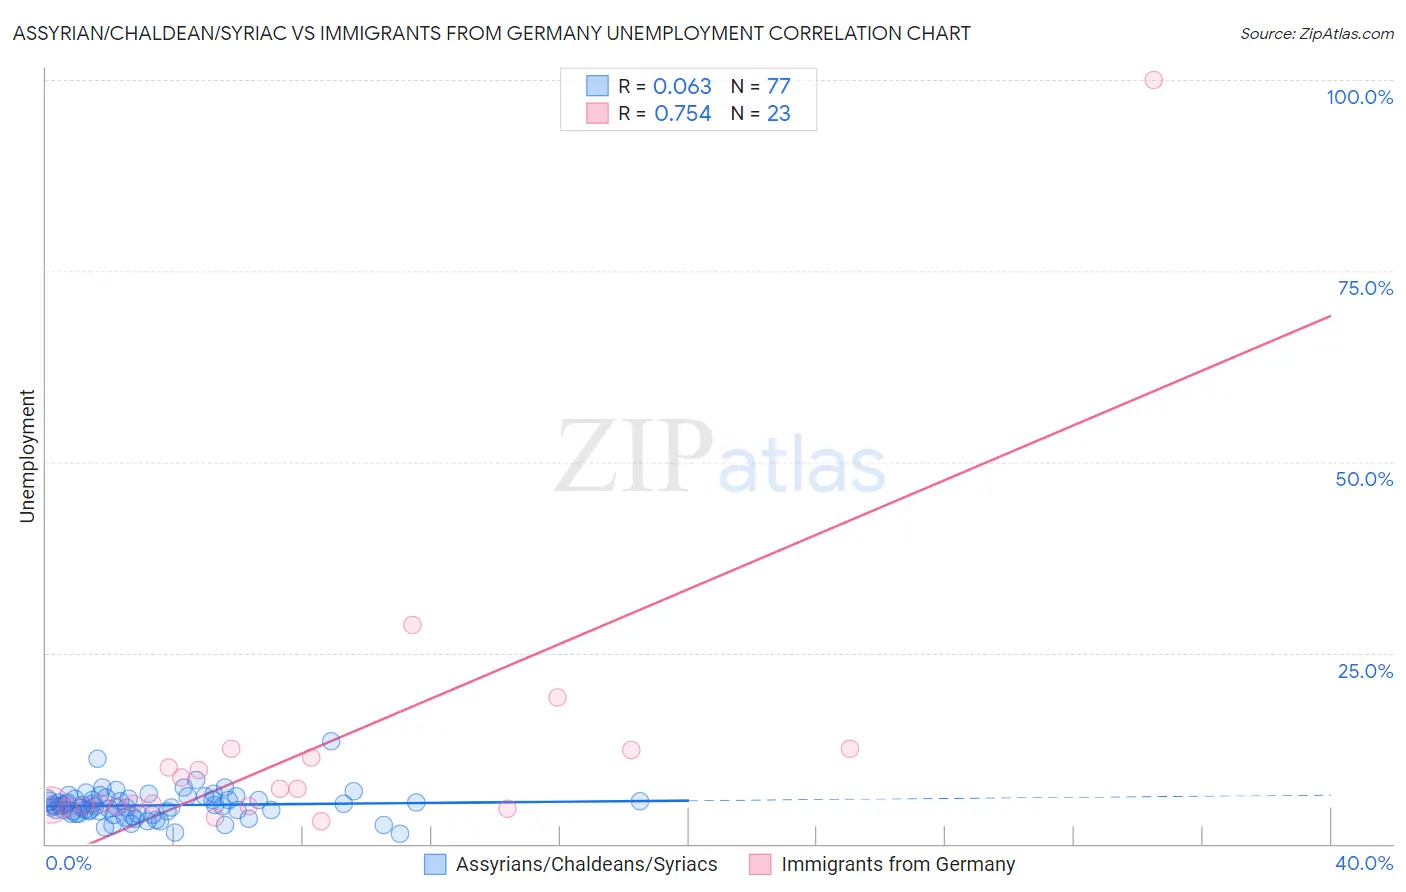
Assyrian/Chaldean/Syriac vs Immigrants from Germany Unemployment Correlation Chart
The statistical analysis conducted on geographies consisting of 110,292,838 people shows a slight positive correlation between the proportion of Assyrians/Chaldeans/Syriacs and unemployment in the United States with a correlation coefficient (R) of 0.063 and weighted average of 5.3%. Similarly, the statistical analysis conducted on geographies consisting of 463,047,668 people shows a strong positive correlation between the proportion of Immigrants from Germany and unemployment in the United States with a correlation coefficient (R) of 0.754 and weighted average of 5.1%, a difference of 4.3%.
Unemployment Correlation Summary
| Measurement | Assyrian/Chaldean/Syriac | Immigrants from Germany |
| Minimum | 1.3% | 2.9% |
| Maximum | 13.4% | 100.0% |
| Range | 12.1% | 97.1% |
| Mean | 5.0% | 12.6% |
| Median | 4.9% | 7.2% |
| Interquartile 25% (IQ1) | 4.0% | 4.9% |
| Interquartile 75% (IQ3) | 5.8% | 12.2% |
| Interquartile Range (IQR) | 1.8% | 7.3% |
| Standard Deviation (Sample) | 1.9% | 19.9% |
| Standard Deviation (Population) | 1.8% | 19.5% |
Similar Demographics by Unemployment
Demographics Similar to Assyrians/Chaldeans/Syriacs by Unemployment
In terms of unemployment, the demographic groups most similar to Assyrians/Chaldeans/Syriacs are Immigrants from Thailand (5.3%, a difference of 0.020%), Brazilian (5.3%, a difference of 0.060%), Immigrants from Uganda (5.3%, a difference of 0.090%), Costa Rican (5.3%, a difference of 0.12%), and Alsatian (5.3%, a difference of 0.14%).
| Demographics | Rating | Rank | Unemployment |
| Immigrants | Nonimmigrants | 47.9 /100 | #177 | Average 5.3% |
| Afghans | 47.4 /100 | #178 | Average 5.3% |
| Malaysians | 46.8 /100 | #179 | Average 5.3% |
| Immigrants | Greece | 45.0 /100 | #180 | Average 5.3% |
| Albanians | 43.5 /100 | #181 | Average 5.3% |
| Spaniards | 42.2 /100 | #182 | Average 5.3% |
| Brazilians | 40.2 /100 | #183 | Average 5.3% |
| Assyrians/Chaldeans/Syriacs | 39.2 /100 | #184 | Fair 5.3% |
| Immigrants | Thailand | 38.9 /100 | #185 | Fair 5.3% |
| Immigrants | Uganda | 37.8 /100 | #186 | Fair 5.3% |
| Costa Ricans | 37.4 /100 | #187 | Fair 5.3% |
| Alsatians | 37.0 /100 | #188 | Fair 5.3% |
| Immigrants | Belarus | 35.6 /100 | #189 | Fair 5.3% |
| Arabs | 35.3 /100 | #190 | Fair 5.3% |
| Somalis | 34.0 /100 | #191 | Fair 5.3% |
Demographics Similar to Immigrants from Germany by Unemployment
In terms of unemployment, the demographic groups most similar to Immigrants from Germany are Immigrants from Malaysia (5.1%, a difference of 0.040%), Immigrants from Sri Lanka (5.1%, a difference of 0.050%), Immigrants from Western Europe (5.1%, a difference of 0.070%), Immigrants from France (5.1%, a difference of 0.20%), and Macedonian (5.1%, a difference of 0.21%).
| Demographics | Rating | Rank | Unemployment |
| Chileans | 93.2 /100 | #111 | Exceptional 5.0% |
| South Africans | 92.6 /100 | #112 | Exceptional 5.1% |
| Argentineans | 92.4 /100 | #113 | Exceptional 5.1% |
| Immigrants | Ireland | 92.1 /100 | #114 | Exceptional 5.1% |
| Immigrants | Western Europe | 91.1 /100 | #115 | Exceptional 5.1% |
| Immigrants | Sri Lanka | 91.1 /100 | #116 | Exceptional 5.1% |
| Immigrants | Malaysia | 91.0 /100 | #117 | Exceptional 5.1% |
| Immigrants | Germany | 90.8 /100 | #118 | Exceptional 5.1% |
| Immigrants | France | 89.7 /100 | #119 | Excellent 5.1% |
| Macedonians | 89.7 /100 | #120 | Excellent 5.1% |
| Lebanese | 89.2 /100 | #121 | Excellent 5.1% |
| Immigrants | Switzerland | 89.1 /100 | #122 | Excellent 5.1% |
| Asians | 89.0 /100 | #123 | Excellent 5.1% |
| Ethiopians | 88.6 /100 | #124 | Excellent 5.1% |
| Immigrants | Eastern Asia | 88.3 /100 | #125 | Excellent 5.1% |