Immigrants from Ghana vs Immigrants from Germany Unemployment
COMPARE
Immigrants from Ghana
Immigrants from Germany
Unemployment
Unemployment Comparison
Immigrants from Ghana
Immigrants from Germany
6.1%
UNEMPLOYMENT
0.0/ 100
METRIC RATING
283rd/ 347
METRIC RANK
5.1%
UNEMPLOYMENT
90.8/ 100
METRIC RATING
118th/ 347
METRIC RANK
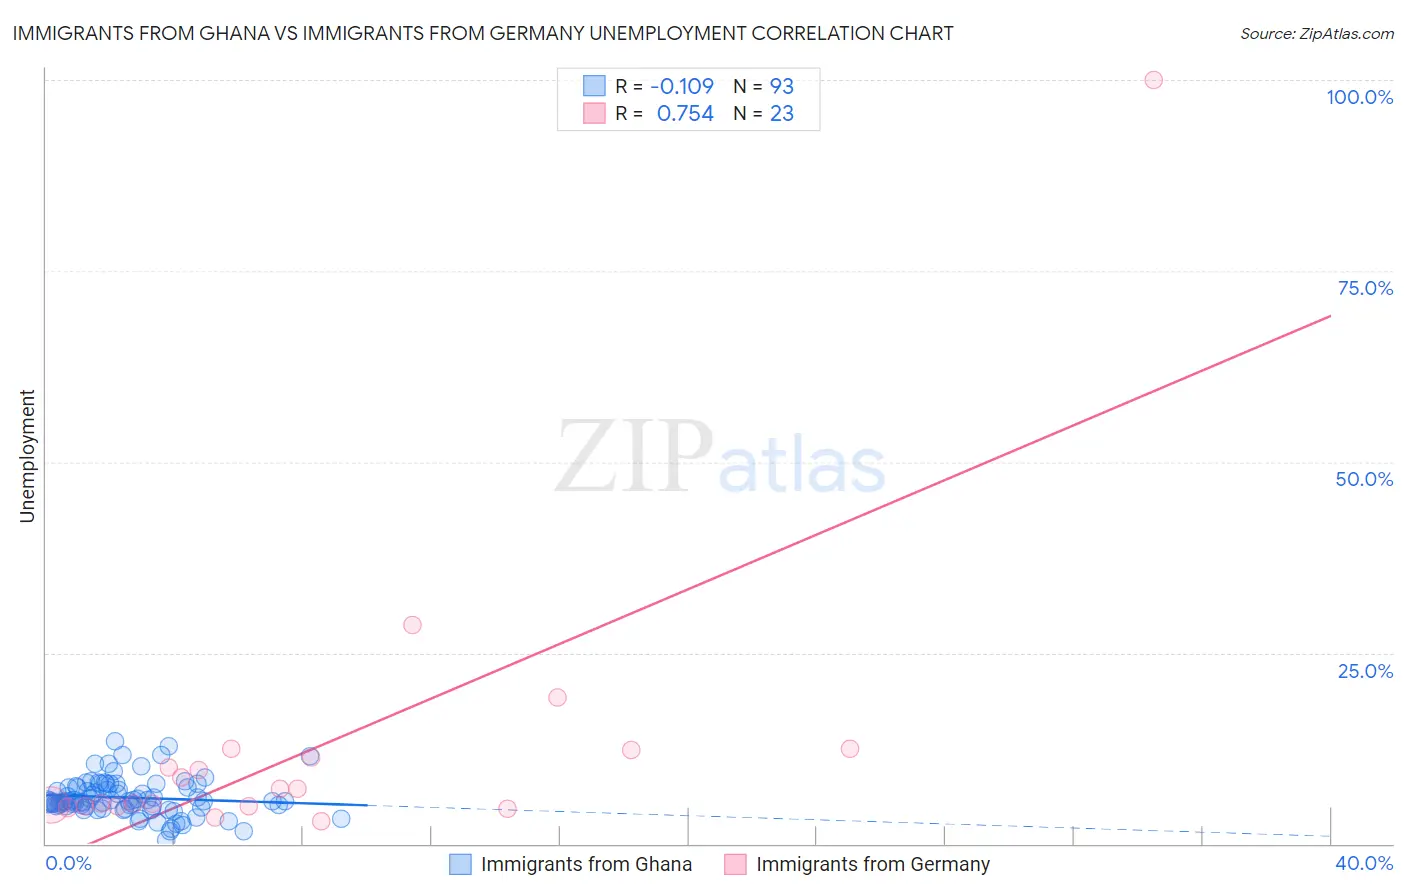
Immigrants from Ghana vs Immigrants from Germany Unemployment Correlation Chart
The statistical analysis conducted on geographies consisting of 199,867,577 people shows a poor negative correlation between the proportion of Immigrants from Ghana and unemployment in the United States with a correlation coefficient (R) of -0.109 and weighted average of 6.1%. Similarly, the statistical analysis conducted on geographies consisting of 463,047,668 people shows a strong positive correlation between the proportion of Immigrants from Germany and unemployment in the United States with a correlation coefficient (R) of 0.754 and weighted average of 5.1%, a difference of 19.5%.
Unemployment Correlation Summary
| Measurement | Immigrants from Ghana | Immigrants from Germany |
| Minimum | 0.50% | 2.9% |
| Maximum | 13.4% | 100.0% |
| Range | 12.9% | 97.1% |
| Mean | 6.0% | 12.6% |
| Median | 5.6% | 7.2% |
| Interquartile 25% (IQ1) | 4.9% | 4.9% |
| Interquartile 75% (IQ3) | 7.4% | 12.2% |
| Interquartile Range (IQR) | 2.5% | 7.3% |
| Standard Deviation (Sample) | 2.4% | 19.9% |
| Standard Deviation (Population) | 2.4% | 19.5% |
Similar Demographics by Unemployment
Demographics Similar to Immigrants from Ghana by Unemployment
In terms of unemployment, the demographic groups most similar to Immigrants from Ghana are Immigrants from the Azores (6.1%, a difference of 0.080%), Aleut (6.1%, a difference of 0.13%), African (6.1%, a difference of 0.15%), Immigrants from Mexico (6.0%, a difference of 0.73%), and Immigrants from Western Africa (6.0%, a difference of 0.73%).
| Demographics | Rating | Rank | Unemployment |
| Immigrants | Central America | 0.0 /100 | #276 | Tragic 6.0% |
| Armenians | 0.0 /100 | #277 | Tragic 6.0% |
| Ghanaians | 0.0 /100 | #278 | Tragic 6.0% |
| Immigrants | Mexico | 0.0 /100 | #279 | Tragic 6.0% |
| Immigrants | Western Africa | 0.0 /100 | #280 | Tragic 6.0% |
| Africans | 0.0 /100 | #281 | Tragic 6.1% |
| Immigrants | Azores | 0.0 /100 | #282 | Tragic 6.1% |
| Immigrants | Ghana | 0.0 /100 | #283 | Tragic 6.1% |
| Aleuts | 0.0 /100 | #284 | Tragic 6.1% |
| Immigrants | Senegal | 0.0 /100 | #285 | Tragic 6.1% |
| Immigrants | Caribbean | 0.0 /100 | #286 | Tragic 6.2% |
| Nepalese | 0.0 /100 | #287 | Tragic 6.2% |
| Ecuadorians | 0.0 /100 | #288 | Tragic 6.2% |
| Chippewa | 0.0 /100 | #289 | Tragic 6.2% |
| Senegalese | 0.0 /100 | #290 | Tragic 6.2% |
Demographics Similar to Immigrants from Germany by Unemployment
In terms of unemployment, the demographic groups most similar to Immigrants from Germany are Immigrants from Malaysia (5.1%, a difference of 0.040%), Immigrants from Sri Lanka (5.1%, a difference of 0.050%), Immigrants from Western Europe (5.1%, a difference of 0.070%), Immigrants from France (5.1%, a difference of 0.20%), and Macedonian (5.1%, a difference of 0.21%).
| Demographics | Rating | Rank | Unemployment |
| Chileans | 93.2 /100 | #111 | Exceptional 5.0% |
| South Africans | 92.6 /100 | #112 | Exceptional 5.1% |
| Argentineans | 92.4 /100 | #113 | Exceptional 5.1% |
| Immigrants | Ireland | 92.1 /100 | #114 | Exceptional 5.1% |
| Immigrants | Western Europe | 91.1 /100 | #115 | Exceptional 5.1% |
| Immigrants | Sri Lanka | 91.1 /100 | #116 | Exceptional 5.1% |
| Immigrants | Malaysia | 91.0 /100 | #117 | Exceptional 5.1% |
| Immigrants | Germany | 90.8 /100 | #118 | Exceptional 5.1% |
| Immigrants | France | 89.7 /100 | #119 | Excellent 5.1% |
| Macedonians | 89.7 /100 | #120 | Excellent 5.1% |
| Lebanese | 89.2 /100 | #121 | Excellent 5.1% |
| Immigrants | Switzerland | 89.1 /100 | #122 | Excellent 5.1% |
| Asians | 89.0 /100 | #123 | Excellent 5.1% |
| Ethiopians | 88.6 /100 | #124 | Excellent 5.1% |
| Immigrants | Eastern Asia | 88.3 /100 | #125 | Excellent 5.1% |