Samoan vs Immigrants from Czechoslovakia Male Unemployment
COMPARE
Samoan
Immigrants from Czechoslovakia
Male Unemployment
Male Unemployment Comparison
Samoans
Immigrants from Czechoslovakia
5.5%
MALE UNEMPLOYMENT
4.9/ 100
METRIC RATING
215th/ 347
METRIC RANK
5.1%
MALE UNEMPLOYMENT
91.7/ 100
METRIC RATING
105th/ 347
METRIC RANK
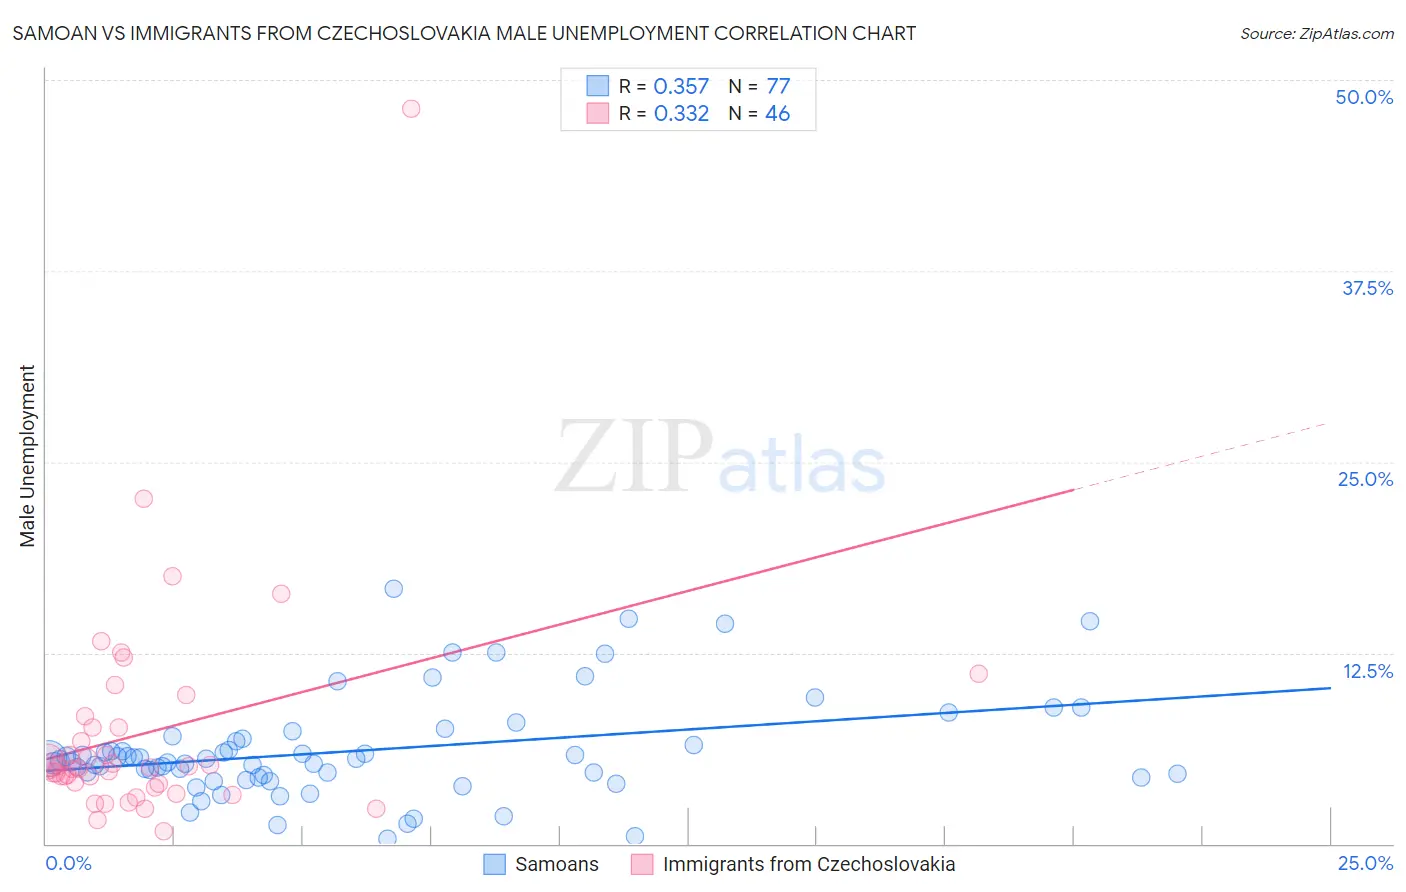
Samoan vs Immigrants from Czechoslovakia Male Unemployment Correlation Chart
The statistical analysis conducted on geographies consisting of 224,577,965 people shows a mild positive correlation between the proportion of Samoans and unemployment rate among males in the United States with a correlation coefficient (R) of 0.357 and weighted average of 5.5%. Similarly, the statistical analysis conducted on geographies consisting of 195,196,064 people shows a mild positive correlation between the proportion of Immigrants from Czechoslovakia and unemployment rate among males in the United States with a correlation coefficient (R) of 0.332 and weighted average of 5.1%, a difference of 8.1%.
Male Unemployment Correlation Summary
| Measurement | Samoan | Immigrants from Czechoslovakia |
| Minimum | 0.30% | 0.80% |
| Maximum | 16.7% | 48.1% |
| Range | 16.4% | 47.3% |
| Mean | 6.1% | 7.3% |
| Median | 5.5% | 5.0% |
| Interquartile 25% (IQ1) | 4.4% | 3.9% |
| Interquartile 75% (IQ3) | 6.8% | 7.6% |
| Interquartile Range (IQR) | 2.4% | 3.7% |
| Standard Deviation (Sample) | 3.3% | 7.6% |
| Standard Deviation (Population) | 3.3% | 7.5% |
Similar Demographics by Male Unemployment
Demographics Similar to Samoans by Male Unemployment
In terms of male unemployment, the demographic groups most similar to Samoans are Immigrants (5.5%, a difference of 0.17%), Puget Sound Salish (5.5%, a difference of 0.20%), Delaware (5.5%, a difference of 0.22%), Ugandan (5.5%, a difference of 0.37%), and Immigrants from Albania (5.5%, a difference of 0.43%).
| Demographics | Rating | Rank | Male Unemployment |
| Immigrants | Lebanon | 8.6 /100 | #208 | Tragic 5.5% |
| Immigrants | Middle Africa | 8.3 /100 | #209 | Tragic 5.5% |
| South American Indians | 7.6 /100 | #210 | Tragic 5.5% |
| Israelis | 7.4 /100 | #211 | Tragic 5.5% |
| Hmong | 7.0 /100 | #212 | Tragic 5.5% |
| Ugandans | 6.3 /100 | #213 | Tragic 5.5% |
| Puget Sound Salish | 5.6 /100 | #214 | Tragic 5.5% |
| Samoans | 4.9 /100 | #215 | Tragic 5.5% |
| Immigrants | Immigrants | 4.3 /100 | #216 | Tragic 5.5% |
| Delaware | 4.2 /100 | #217 | Tragic 5.5% |
| Immigrants | Albania | 3.6 /100 | #218 | Tragic 5.5% |
| Immigrants | Western Asia | 3.5 /100 | #219 | Tragic 5.6% |
| Portuguese | 3.5 /100 | #220 | Tragic 5.6% |
| Soviet Union | 3.2 /100 | #221 | Tragic 5.6% |
| Immigrants | Micronesia | 2.9 /100 | #222 | Tragic 5.6% |
Demographics Similar to Immigrants from Czechoslovakia by Male Unemployment
In terms of male unemployment, the demographic groups most similar to Immigrants from Czechoslovakia are Immigrants from Chile (5.1%, a difference of 0.010%), Immigrants from Jordan (5.1%, a difference of 0.040%), Immigrants from Ethiopia (5.1%, a difference of 0.040%), Ethiopian (5.1%, a difference of 0.080%), and Immigrants from Nicaragua (5.1%, a difference of 0.090%).
| Demographics | Rating | Rank | Male Unemployment |
| Immigrants | Kuwait | 93.3 /100 | #98 | Exceptional 5.1% |
| Uruguayans | 93.0 /100 | #99 | Exceptional 5.1% |
| Russians | 92.9 /100 | #100 | Exceptional 5.1% |
| German Russians | 92.7 /100 | #101 | Exceptional 5.1% |
| Immigrants | France | 92.7 /100 | #102 | Exceptional 5.1% |
| Immigrants | Jordan | 91.9 /100 | #103 | Exceptional 5.1% |
| Immigrants | Chile | 91.8 /100 | #104 | Exceptional 5.1% |
| Immigrants | Czechoslovakia | 91.7 /100 | #105 | Exceptional 5.1% |
| Immigrants | Ethiopia | 91.5 /100 | #106 | Exceptional 5.1% |
| Ethiopians | 91.3 /100 | #107 | Exceptional 5.1% |
| Immigrants | Nicaragua | 91.2 /100 | #108 | Exceptional 5.1% |
| Immigrants | Pakistan | 90.9 /100 | #109 | Exceptional 5.1% |
| Immigrants | England | 90.8 /100 | #110 | Exceptional 5.1% |
| Immigrants | Eastern Asia | 90.8 /100 | #111 | Exceptional 5.1% |
| Immigrants | Moldova | 90.3 /100 | #112 | Exceptional 5.1% |