Greek vs Immigrants from Czechoslovakia Male Unemployment
COMPARE
Greek
Immigrants from Czechoslovakia
Male Unemployment
Male Unemployment Comparison
Greeks
Immigrants from Czechoslovakia
5.0%
MALE UNEMPLOYMENT
97.0/ 100
METRIC RATING
73rd/ 347
METRIC RANK
5.1%
MALE UNEMPLOYMENT
91.7/ 100
METRIC RATING
105th/ 347
METRIC RANK
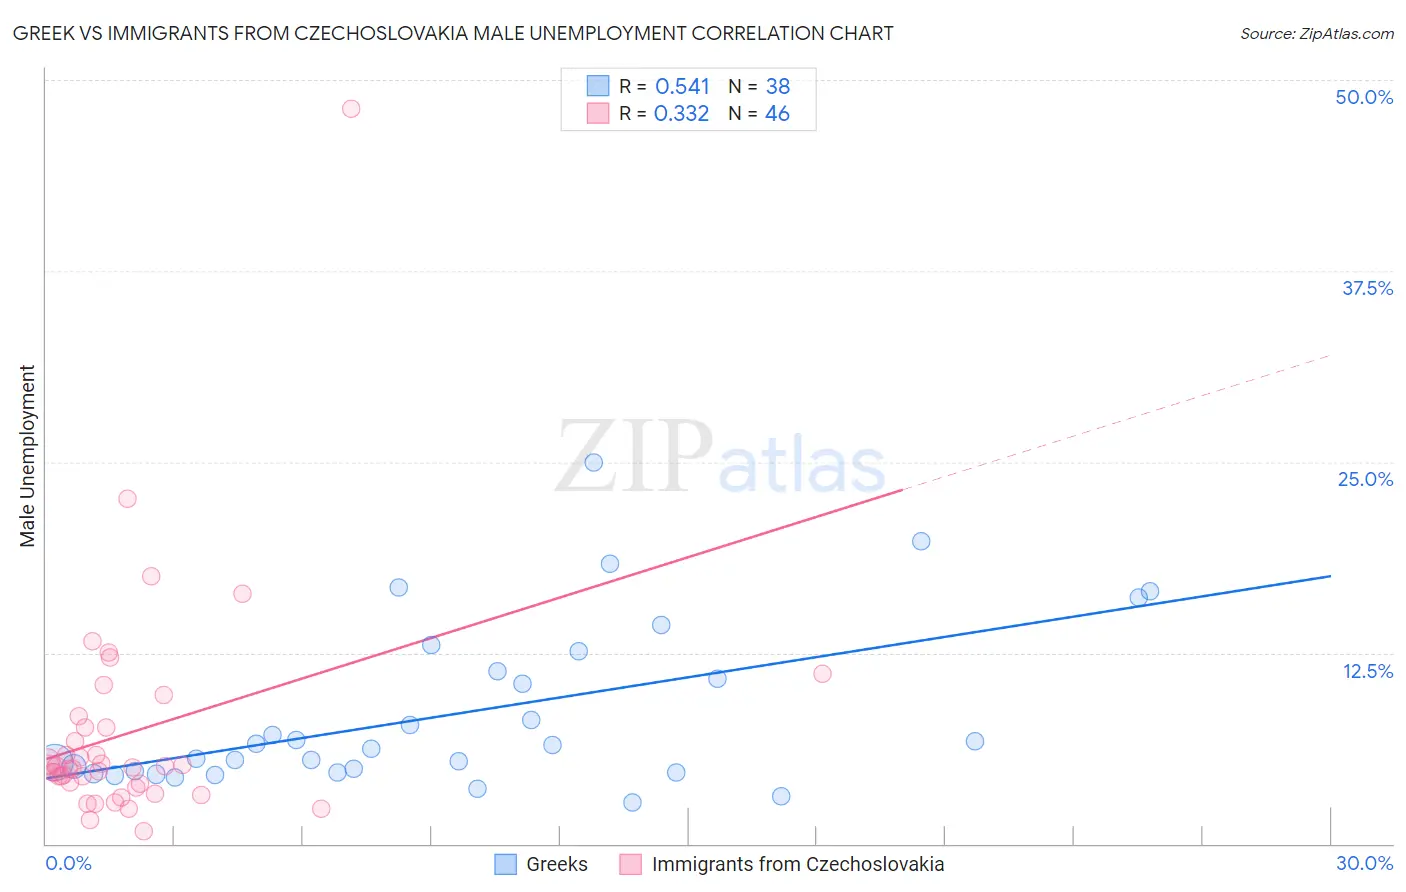
Greek vs Immigrants from Czechoslovakia Male Unemployment Correlation Chart
The statistical analysis conducted on geographies consisting of 479,076,268 people shows a substantial positive correlation between the proportion of Greeks and unemployment rate among males in the United States with a correlation coefficient (R) of 0.541 and weighted average of 5.0%. Similarly, the statistical analysis conducted on geographies consisting of 195,196,064 people shows a mild positive correlation between the proportion of Immigrants from Czechoslovakia and unemployment rate among males in the United States with a correlation coefficient (R) of 0.332 and weighted average of 5.1%, a difference of 1.6%.
Male Unemployment Correlation Summary
| Measurement | Greek | Immigrants from Czechoslovakia |
| Minimum | 2.7% | 0.80% |
| Maximum | 25.0% | 48.1% |
| Range | 22.3% | 47.3% |
| Mean | 8.5% | 7.3% |
| Median | 6.3% | 5.0% |
| Interquartile 25% (IQ1) | 4.7% | 3.9% |
| Interquartile 75% (IQ3) | 11.3% | 7.6% |
| Interquartile Range (IQR) | 6.6% | 3.7% |
| Standard Deviation (Sample) | 5.4% | 7.6% |
| Standard Deviation (Population) | 5.3% | 7.5% |
Similar Demographics by Male Unemployment
Demographics Similar to Greeks by Male Unemployment
In terms of male unemployment, the demographic groups most similar to Greeks are Immigrants from North America (5.0%, a difference of 0.030%), Assyrian/Chaldean/Syriac (5.0%, a difference of 0.060%), Immigrants from South Africa (5.0%, a difference of 0.080%), New Zealander (5.0%, a difference of 0.16%), and White/Caucasian (5.0%, a difference of 0.18%).
| Demographics | Rating | Rank | Male Unemployment |
| Finns | 97.5 /100 | #66 | Exceptional 5.0% |
| Immigrants | Canada | 97.5 /100 | #67 | Exceptional 5.0% |
| Australians | 97.4 /100 | #68 | Exceptional 5.0% |
| Immigrants | Sweden | 97.4 /100 | #69 | Exceptional 5.0% |
| Whites/Caucasians | 97.3 /100 | #70 | Exceptional 5.0% |
| New Zealanders | 97.3 /100 | #71 | Exceptional 5.0% |
| Immigrants | South Africa | 97.1 /100 | #72 | Exceptional 5.0% |
| Greeks | 97.0 /100 | #73 | Exceptional 5.0% |
| Immigrants | North America | 96.9 /100 | #74 | Exceptional 5.0% |
| Assyrians/Chaldeans/Syriacs | 96.9 /100 | #75 | Exceptional 5.0% |
| Immigrants | Sudan | 96.5 /100 | #76 | Exceptional 5.0% |
| Iranians | 96.4 /100 | #77 | Exceptional 5.0% |
| Immigrants | Northern Europe | 96.4 /100 | #78 | Exceptional 5.0% |
| South Africans | 96.4 /100 | #79 | Exceptional 5.0% |
| Argentineans | 96.2 /100 | #80 | Exceptional 5.0% |
Demographics Similar to Immigrants from Czechoslovakia by Male Unemployment
In terms of male unemployment, the demographic groups most similar to Immigrants from Czechoslovakia are Immigrants from Chile (5.1%, a difference of 0.010%), Immigrants from Jordan (5.1%, a difference of 0.040%), Immigrants from Ethiopia (5.1%, a difference of 0.040%), Ethiopian (5.1%, a difference of 0.080%), and Immigrants from Nicaragua (5.1%, a difference of 0.090%).
| Demographics | Rating | Rank | Male Unemployment |
| Immigrants | Kuwait | 93.3 /100 | #98 | Exceptional 5.1% |
| Uruguayans | 93.0 /100 | #99 | Exceptional 5.1% |
| Russians | 92.9 /100 | #100 | Exceptional 5.1% |
| German Russians | 92.7 /100 | #101 | Exceptional 5.1% |
| Immigrants | France | 92.7 /100 | #102 | Exceptional 5.1% |
| Immigrants | Jordan | 91.9 /100 | #103 | Exceptional 5.1% |
| Immigrants | Chile | 91.8 /100 | #104 | Exceptional 5.1% |
| Immigrants | Czechoslovakia | 91.7 /100 | #105 | Exceptional 5.1% |
| Immigrants | Ethiopia | 91.5 /100 | #106 | Exceptional 5.1% |
| Ethiopians | 91.3 /100 | #107 | Exceptional 5.1% |
| Immigrants | Nicaragua | 91.2 /100 | #108 | Exceptional 5.1% |
| Immigrants | Pakistan | 90.9 /100 | #109 | Exceptional 5.1% |
| Immigrants | England | 90.8 /100 | #110 | Exceptional 5.1% |
| Immigrants | Eastern Asia | 90.8 /100 | #111 | Exceptional 5.1% |
| Immigrants | Moldova | 90.3 /100 | #112 | Exceptional 5.1% |