Alaska Native vs Immigrants from Singapore Male Unemployment
COMPARE
Alaska Native
Immigrants from Singapore
Male Unemployment
Male Unemployment Comparison
Alaska Natives
Immigrants from Singapore
8.1%
MALE UNEMPLOYMENT
0.0/ 100
METRIC RATING
331st/ 347
METRIC RANK
4.9%
MALE UNEMPLOYMENT
99.4/ 100
METRIC RATING
36th/ 347
METRIC RANK
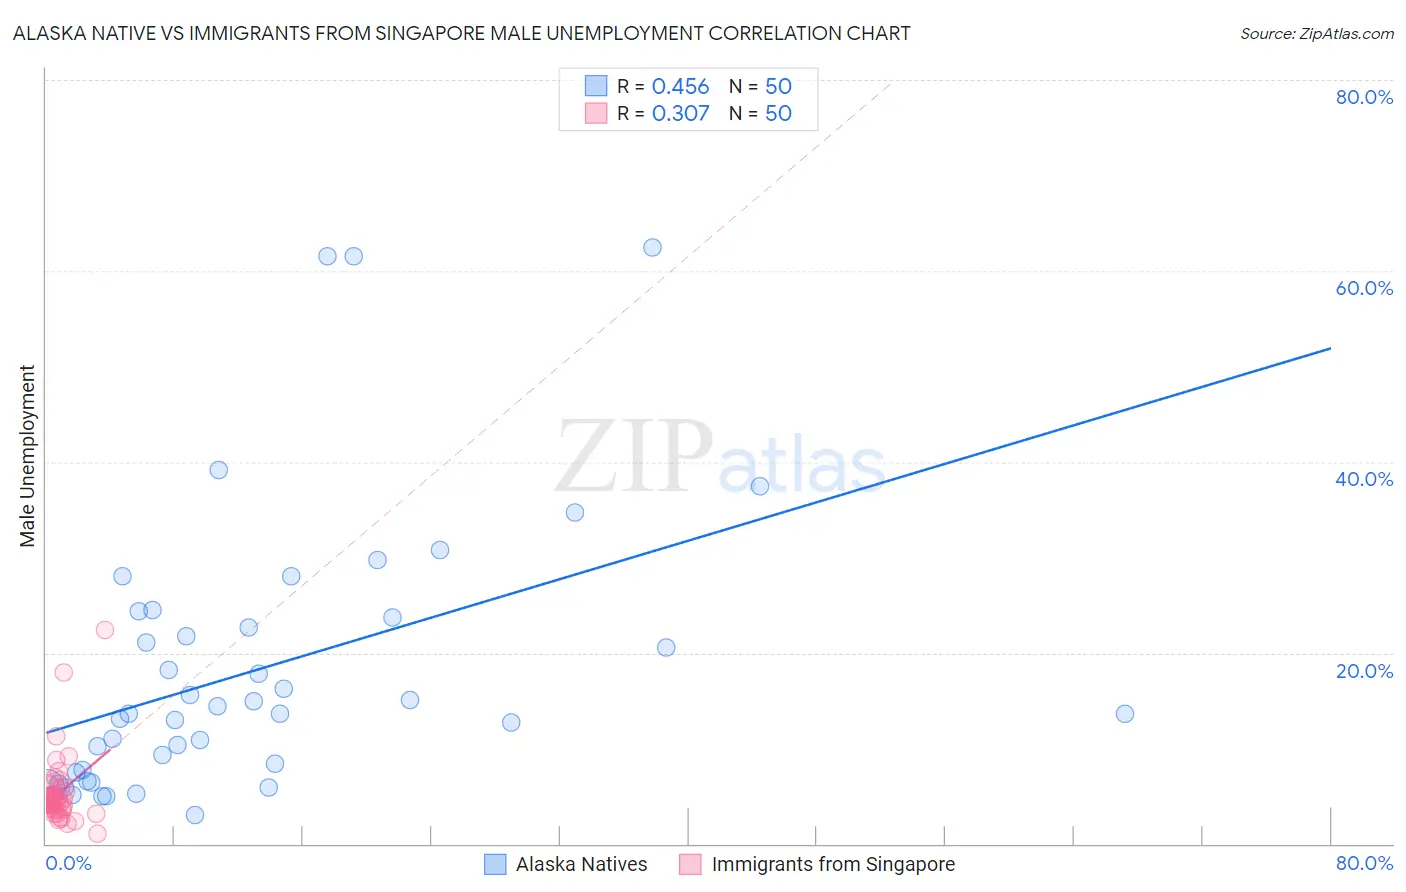
Alaska Native vs Immigrants from Singapore Male Unemployment Correlation Chart
The statistical analysis conducted on geographies consisting of 76,676,462 people shows a moderate positive correlation between the proportion of Alaska Natives and unemployment rate among males in the United States with a correlation coefficient (R) of 0.456 and weighted average of 8.1%. Similarly, the statistical analysis conducted on geographies consisting of 137,392,215 people shows a mild positive correlation between the proportion of Immigrants from Singapore and unemployment rate among males in the United States with a correlation coefficient (R) of 0.307 and weighted average of 4.9%, a difference of 65.1%.
Male Unemployment Correlation Summary
| Measurement | Alaska Native | Immigrants from Singapore |
| Minimum | 3.0% | 1.1% |
| Maximum | 62.5% | 22.4% |
| Range | 59.5% | 21.3% |
| Mean | 18.1% | 5.3% |
| Median | 13.6% | 4.4% |
| Interquartile 25% (IQ1) | 7.5% | 3.6% |
| Interquartile 75% (IQ3) | 23.7% | 5.1% |
| Interquartile Range (IQR) | 16.2% | 1.4% |
| Standard Deviation (Sample) | 14.4% | 3.6% |
| Standard Deviation (Population) | 14.3% | 3.6% |
Similar Demographics by Male Unemployment
Demographics Similar to Alaska Natives by Male Unemployment
In terms of male unemployment, the demographic groups most similar to Alaska Natives are Yakama (7.9%, a difference of 1.9%), Pima (8.3%, a difference of 2.4%), Immigrants from Yemen (7.8%, a difference of 3.7%), Sioux (8.4%, a difference of 3.7%), and Native/Alaskan (7.7%, a difference of 4.7%).
| Demographics | Rating | Rank | Male Unemployment |
| Dominicans | 0.0 /100 | #324 | Tragic 7.6% |
| Shoshone | 0.0 /100 | #325 | Tragic 7.6% |
| Immigrants | Dominican Republic | 0.0 /100 | #326 | Tragic 7.6% |
| Paiute | 0.0 /100 | #327 | Tragic 7.7% |
| Natives/Alaskans | 0.0 /100 | #328 | Tragic 7.7% |
| Immigrants | Yemen | 0.0 /100 | #329 | Tragic 7.8% |
| Yakama | 0.0 /100 | #330 | Tragic 7.9% |
| Alaska Natives | 0.0 /100 | #331 | Tragic 8.1% |
| Pima | 0.0 /100 | #332 | Tragic 8.3% |
| Sioux | 0.0 /100 | #333 | Tragic 8.4% |
| Tsimshian | 0.0 /100 | #334 | Tragic 8.5% |
| Pueblo | 0.0 /100 | #335 | Tragic 8.5% |
| Yuman | 0.0 /100 | #336 | Tragic 8.6% |
| Puerto Ricans | 0.0 /100 | #337 | Tragic 8.6% |
| Apache | 0.0 /100 | #338 | Tragic 8.6% |
Demographics Similar to Immigrants from Singapore by Male Unemployment
In terms of male unemployment, the demographic groups most similar to Immigrants from Singapore are Paraguayan (4.9%, a difference of 0.080%), Scotch-Irish (4.9%, a difference of 0.21%), Immigrants from Bosnia and Herzegovina (4.9%, a difference of 0.23%), Burmese (4.9%, a difference of 0.30%), and Northern European (4.9%, a difference of 0.38%).
| Demographics | Rating | Rank | Male Unemployment |
| Scottish | 99.8 /100 | #29 | Exceptional 4.8% |
| British | 99.8 /100 | #30 | Exceptional 4.8% |
| Sudanese | 99.8 /100 | #31 | Exceptional 4.8% |
| Immigrants | Nepal | 99.8 /100 | #32 | Exceptional 4.8% |
| Latvians | 99.7 /100 | #33 | Exceptional 4.8% |
| Welsh | 99.7 /100 | #34 | Exceptional 4.8% |
| Paraguayans | 99.5 /100 | #35 | Exceptional 4.9% |
| Immigrants | Singapore | 99.4 /100 | #36 | Exceptional 4.9% |
| Scotch-Irish | 99.4 /100 | #37 | Exceptional 4.9% |
| Immigrants | Bosnia and Herzegovina | 99.4 /100 | #38 | Exceptional 4.9% |
| Burmese | 99.3 /100 | #39 | Exceptional 4.9% |
| Northern Europeans | 99.3 /100 | #40 | Exceptional 4.9% |
| Chinese | 99.3 /100 | #41 | Exceptional 4.9% |
| Immigrants | Belgium | 99.2 /100 | #42 | Exceptional 4.9% |
| Immigrants | Japan | 99.2 /100 | #43 | Exceptional 4.9% |