Alaska Native vs Puget Sound Salish Vision Disability
COMPARE
Alaska Native
Puget Sound Salish
Vision Disability
Vision Disability Comparison
Alaska Natives
Puget Sound Salish
2.7%
VISION DISABILITY
0.0/ 100
METRIC RATING
318th/ 347
METRIC RANK
2.5%
VISION DISABILITY
0.0/ 100
METRIC RATING
283rd/ 347
METRIC RANK
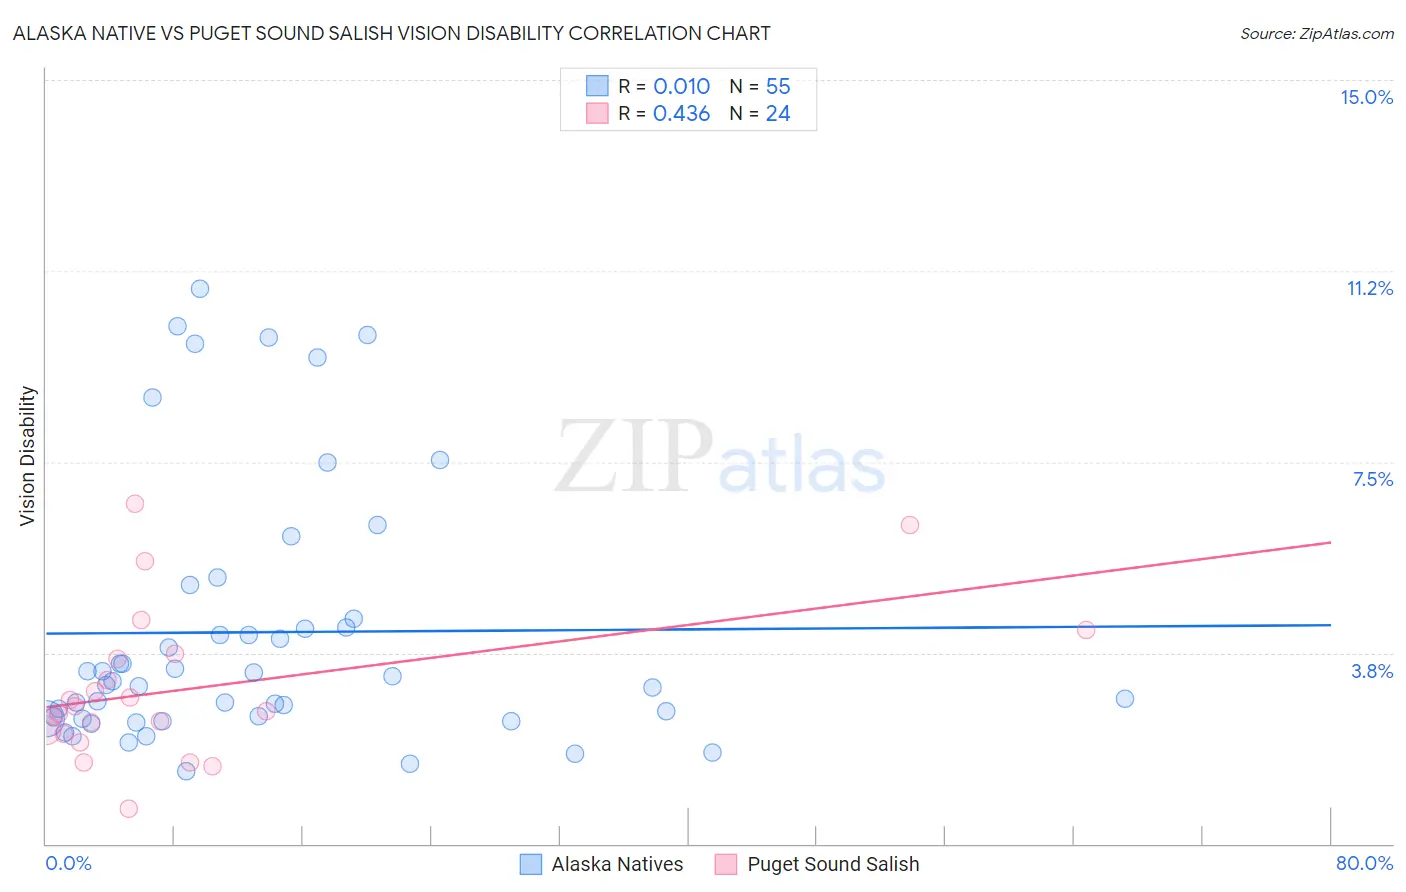
Alaska Native vs Puget Sound Salish Vision Disability Correlation Chart
The statistical analysis conducted on geographies consisting of 76,749,466 people shows no correlation between the proportion of Alaska Natives and percentage of population with vision disability in the United States with a correlation coefficient (R) of 0.010 and weighted average of 2.7%. Similarly, the statistical analysis conducted on geographies consisting of 46,150,765 people shows a moderate positive correlation between the proportion of Puget Sound Salish and percentage of population with vision disability in the United States with a correlation coefficient (R) of 0.436 and weighted average of 2.5%, a difference of 11.1%.
Vision Disability Correlation Summary
| Measurement | Alaska Native | Puget Sound Salish |
| Minimum | 1.4% | 0.69% |
| Maximum | 10.9% | 6.7% |
| Range | 9.5% | 6.0% |
| Mean | 4.2% | 3.1% |
| Median | 3.2% | 2.6% |
| Interquartile 25% (IQ1) | 2.5% | 2.2% |
| Interquartile 75% (IQ3) | 4.4% | 3.7% |
| Interquartile Range (IQR) | 1.9% | 1.5% |
| Standard Deviation (Sample) | 2.6% | 1.5% |
| Standard Deviation (Population) | 2.5% | 1.4% |
Similar Demographics by Vision Disability
Demographics Similar to Alaska Natives by Vision Disability
In terms of vision disability, the demographic groups most similar to Alaska Natives are Yup'ik (2.7%, a difference of 1.1%), Shoshone (2.7%, a difference of 1.3%), Tohono O'odham (2.8%, a difference of 1.4%), Osage (2.7%, a difference of 1.8%), and Black/African American (2.8%, a difference of 2.1%).
| Demographics | Rating | Rank | Vision Disability |
| Dominicans | 0.0 /100 | #311 | Tragic 2.6% |
| Americans | 0.0 /100 | #312 | Tragic 2.6% |
| Potawatomi | 0.0 /100 | #313 | Tragic 2.6% |
| Inupiat | 0.0 /100 | #314 | Tragic 2.7% |
| Osage | 0.0 /100 | #315 | Tragic 2.7% |
| Shoshone | 0.0 /100 | #316 | Tragic 2.7% |
| Yup'ik | 0.0 /100 | #317 | Tragic 2.7% |
| Alaska Natives | 0.0 /100 | #318 | Tragic 2.7% |
| Tohono O'odham | 0.0 /100 | #319 | Tragic 2.8% |
| Blacks/African Americans | 0.0 /100 | #320 | Tragic 2.8% |
| Comanche | 0.0 /100 | #321 | Tragic 2.8% |
| Paiute | 0.0 /100 | #322 | Tragic 2.9% |
| Tlingit-Haida | 0.0 /100 | #323 | Tragic 2.9% |
| Hopi | 0.0 /100 | #324 | Tragic 2.9% |
| Cherokee | 0.0 /100 | #325 | Tragic 2.9% |
Demographics Similar to Puget Sound Salish by Vision Disability
In terms of vision disability, the demographic groups most similar to Puget Sound Salish are Immigrants from Caribbean (2.5%, a difference of 0.13%), U.S. Virgin Islander (2.5%, a difference of 0.25%), Yakama (2.5%, a difference of 0.28%), Immigrants from Central America (2.5%, a difference of 0.30%), and Sioux (2.5%, a difference of 0.31%).
| Demographics | Rating | Rank | Vision Disability |
| Scotch-Irish | 0.0 /100 | #276 | Tragic 2.4% |
| Bahamians | 0.0 /100 | #277 | Tragic 2.4% |
| Spanish | 0.0 /100 | #278 | Tragic 2.4% |
| Nepalese | 0.0 /100 | #279 | Tragic 2.4% |
| Cape Verdeans | 0.0 /100 | #280 | Tragic 2.4% |
| U.S. Virgin Islanders | 0.0 /100 | #281 | Tragic 2.5% |
| Immigrants | Caribbean | 0.0 /100 | #282 | Tragic 2.5% |
| Puget Sound Salish | 0.0 /100 | #283 | Tragic 2.5% |
| Yakama | 0.0 /100 | #284 | Tragic 2.5% |
| Immigrants | Central America | 0.0 /100 | #285 | Tragic 2.5% |
| Sioux | 0.0 /100 | #286 | Tragic 2.5% |
| Hondurans | 0.0 /100 | #287 | Tragic 2.5% |
| French American Indians | 0.0 /100 | #288 | Tragic 2.5% |
| Immigrants | Nonimmigrants | 0.0 /100 | #289 | Tragic 2.5% |
| Immigrants | Cuba | 0.0 /100 | #290 | Tragic 2.5% |