African vs West Indian In Labor Force | Age 16-19
COMPARE
African
West Indian
In Labor Force | Age 16-19
In Labor Force | Age 16-19 Comparison
Africans
West Indians
38.0%
IN LABOR FORCE | AGE 16-19
95.6/ 100
METRIC RATING
126th/ 347
METRIC RANK
31.3%
IN LABOR FORCE | AGE 16-19
0.0/ 100
METRIC RATING
321st/ 347
METRIC RANK
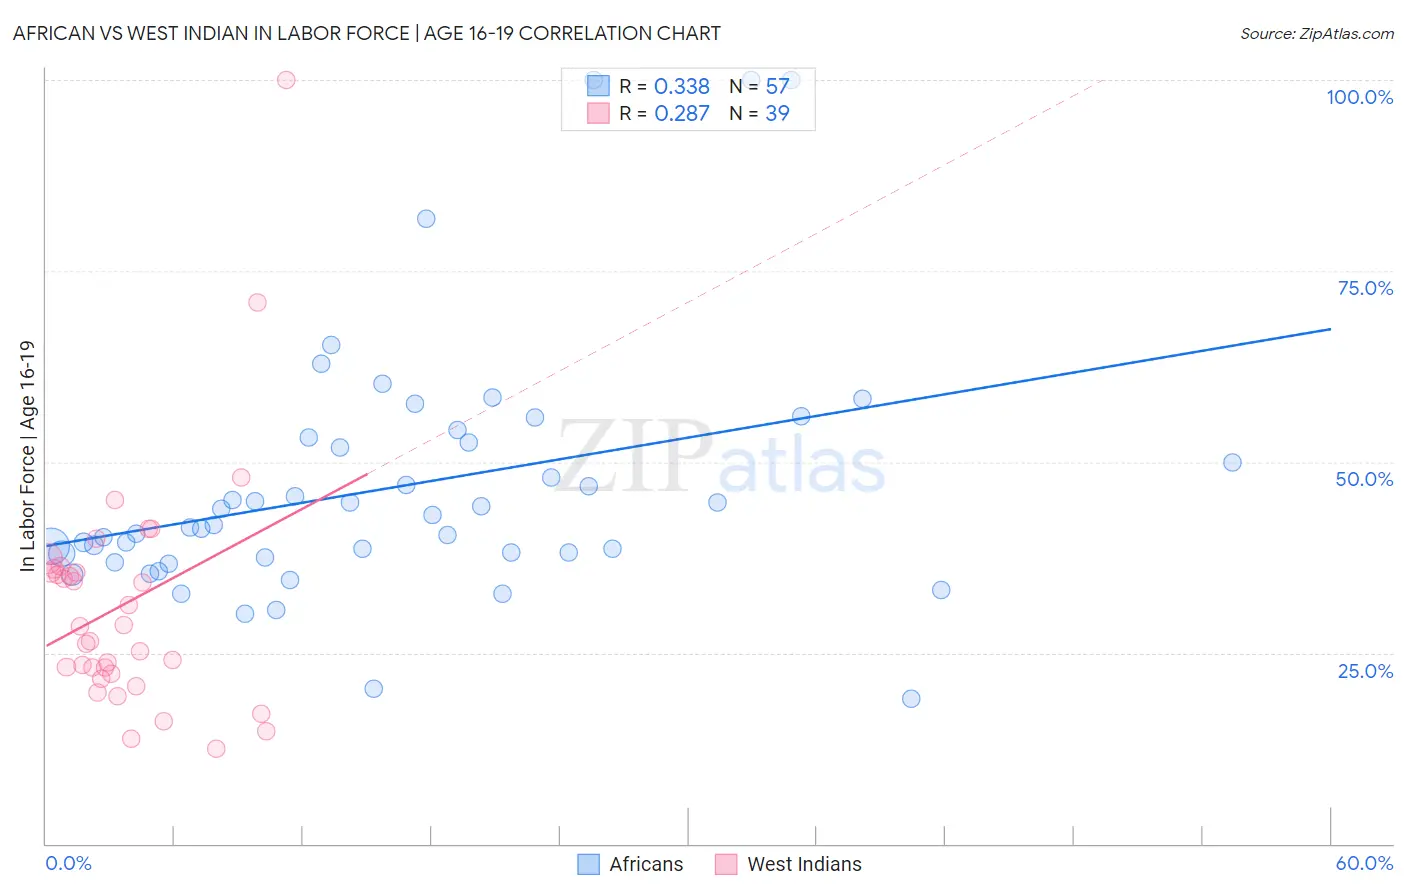
African vs West Indian In Labor Force | Age 16-19 Correlation Chart
The statistical analysis conducted on geographies consisting of 469,169,744 people shows a mild positive correlation between the proportion of Africans and labor force participation rate among population between the ages 16 and 19 in the United States with a correlation coefficient (R) of 0.338 and weighted average of 38.0%. Similarly, the statistical analysis conducted on geographies consisting of 253,845,757 people shows a weak positive correlation between the proportion of West Indians and labor force participation rate among population between the ages 16 and 19 in the United States with a correlation coefficient (R) of 0.287 and weighted average of 31.3%, a difference of 21.3%.
In Labor Force | Age 16-19 Correlation Summary
| Measurement | African | West Indian |
| Minimum | 19.0% | 12.5% |
| Maximum | 100.0% | 100.0% |
| Range | 81.0% | 87.5% |
| Mean | 46.7% | 31.4% |
| Median | 41.8% | 28.5% |
| Interquartile 25% (IQ1) | 37.8% | 22.3% |
| Interquartile 75% (IQ3) | 52.9% | 35.9% |
| Interquartile Range (IQR) | 15.1% | 13.6% |
| Standard Deviation (Sample) | 16.6% | 15.9% |
| Standard Deviation (Population) | 16.5% | 15.7% |
Similar Demographics by In Labor Force | Age 16-19
Demographics Similar to Africans by In Labor Force | Age 16-19
In terms of in labor force | age 16-19, the demographic groups most similar to Africans are Choctaw (38.0%, a difference of 0.010%), New Zealander (38.0%, a difference of 0.010%), Spaniard (38.0%, a difference of 0.030%), Immigrants from Zimbabwe (38.0%, a difference of 0.060%), and Immigrants from Africa (38.0%, a difference of 0.16%).
| Demographics | Rating | Rank | In Labor Force | Age 16-19 |
| Assyrians/Chaldeans/Syriacs | 97.8 /100 | #119 | Exceptional 38.3% |
| Ukrainians | 97.6 /100 | #120 | Exceptional 38.3% |
| Ethiopians | 97.4 /100 | #121 | Exceptional 38.2% |
| Guamanians/Chamorros | 97.4 /100 | #122 | Exceptional 38.2% |
| Seminole | 96.7 /100 | #123 | Exceptional 38.1% |
| Immigrants | England | 96.4 /100 | #124 | Exceptional 38.1% |
| Immigrants | Africa | 96.1 /100 | #125 | Exceptional 38.0% |
| Africans | 95.6 /100 | #126 | Exceptional 38.0% |
| Choctaw | 95.6 /100 | #127 | Exceptional 38.0% |
| New Zealanders | 95.6 /100 | #128 | Exceptional 38.0% |
| Spaniards | 95.5 /100 | #129 | Exceptional 38.0% |
| Immigrants | Zimbabwe | 95.4 /100 | #130 | Exceptional 38.0% |
| Immigrants | Austria | 95.0 /100 | #131 | Exceptional 37.9% |
| Immigrants | Oceania | 94.7 /100 | #132 | Exceptional 37.9% |
| Cheyenne | 94.6 /100 | #133 | Exceptional 37.9% |
Demographics Similar to West Indians by In Labor Force | Age 16-19
In terms of in labor force | age 16-19, the demographic groups most similar to West Indians are Tohono O'odham (31.3%, a difference of 0.12%), Ecuadorian (31.4%, a difference of 0.23%), Immigrants from Caribbean (31.2%, a difference of 0.25%), Soviet Union (31.4%, a difference of 0.30%), and Dominican (31.2%, a difference of 0.43%).
| Demographics | Rating | Rank | In Labor Force | Age 16-19 |
| Cubans | 0.0 /100 | #314 | Tragic 31.8% |
| Immigrants | West Indies | 0.0 /100 | #315 | Tragic 31.7% |
| Filipinos | 0.0 /100 | #316 | Tragic 31.7% |
| Immigrants | Nicaragua | 0.0 /100 | #317 | Tragic 31.6% |
| Immigrants | Yemen | 0.0 /100 | #318 | Tragic 31.5% |
| Soviet Union | 0.0 /100 | #319 | Tragic 31.4% |
| Ecuadorians | 0.0 /100 | #320 | Tragic 31.4% |
| West Indians | 0.0 /100 | #321 | Tragic 31.3% |
| Tohono O'odham | 0.0 /100 | #322 | Tragic 31.3% |
| Immigrants | Caribbean | 0.0 /100 | #323 | Tragic 31.2% |
| Dominicans | 0.0 /100 | #324 | Tragic 31.2% |
| Immigrants | China | 0.0 /100 | #325 | Tragic 31.1% |
| Immigrants | Dominican Republic | 0.0 /100 | #326 | Tragic 31.1% |
| Immigrants | Taiwan | 0.0 /100 | #327 | Tragic 31.0% |
| Immigrants | Ecuador | 0.0 /100 | #328 | Tragic 31.0% |