African vs West Indian Unemployment Among Seniors over 75 years
COMPARE
African
West Indian
Unemployment Among Seniors over 75 years
Unemployment Among Seniors over 75 years Comparison
Africans
West Indians
9.1%
UNEMPLOYMENT AMONG SENIORS OVER 75 YEARS
4.9/ 100
METRIC RATING
232nd/ 347
METRIC RANK
8.8%
UNEMPLOYMENT AMONG SENIORS OVER 75 YEARS
41.9/ 100
METRIC RATING
178th/ 347
METRIC RANK
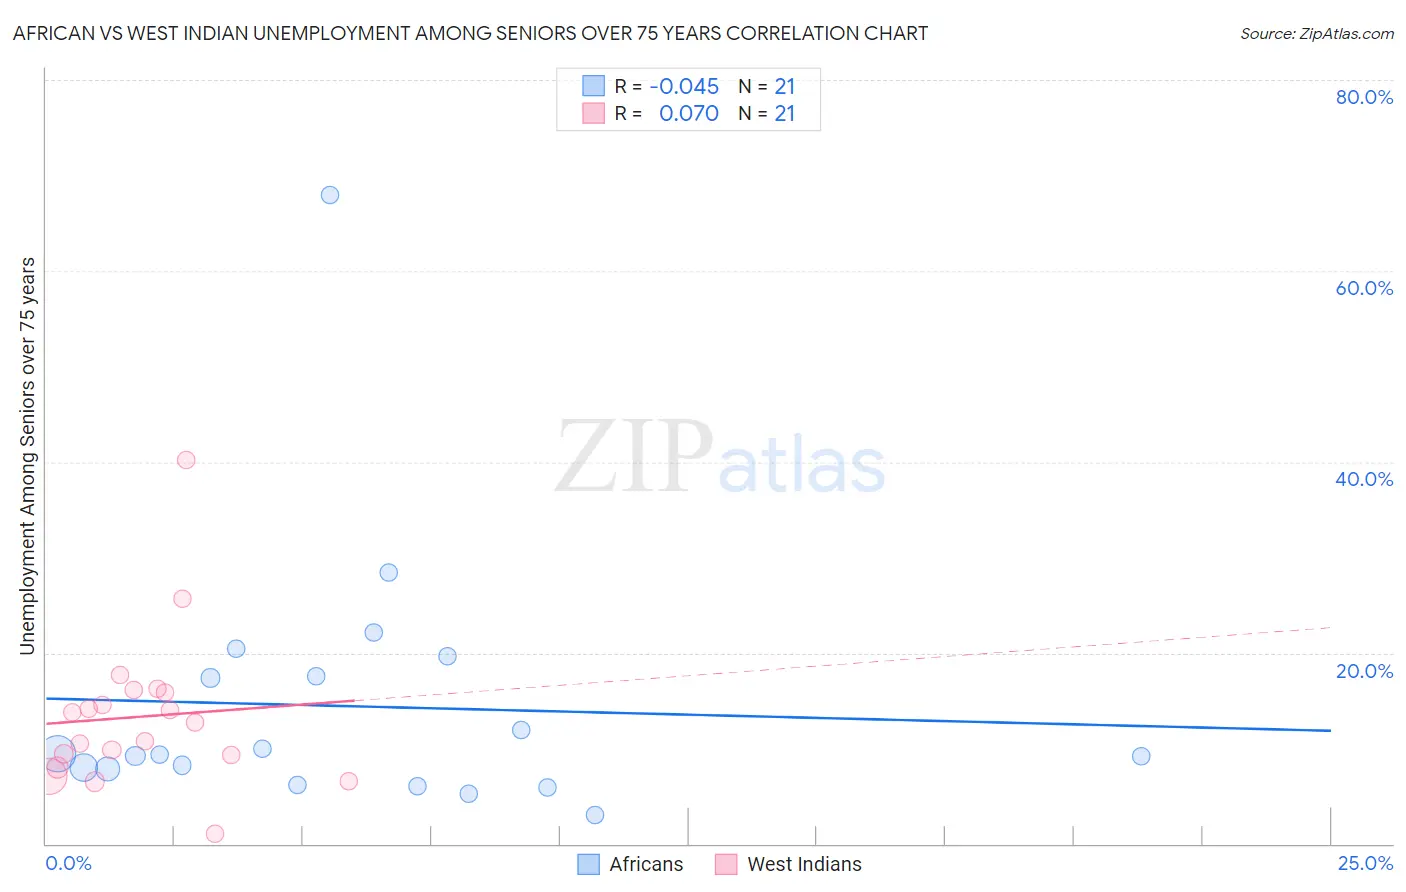
African vs West Indian Unemployment Among Seniors over 75 years Correlation Chart
The statistical analysis conducted on geographies consisting of 219,473,985 people shows no correlation between the proportion of Africans and unemployment rate among seniors over the age of 75 in the United States with a correlation coefficient (R) of -0.045 and weighted average of 9.1%. Similarly, the statistical analysis conducted on geographies consisting of 148,189,675 people shows a slight positive correlation between the proportion of West Indians and unemployment rate among seniors over the age of 75 in the United States with a correlation coefficient (R) of 0.070 and weighted average of 8.8%, a difference of 3.5%.
Unemployment Among Seniors over 75 years Correlation Summary
| Measurement | African | West Indian |
| Minimum | 3.0% | 1.0% |
| Maximum | 67.9% | 40.2% |
| Range | 64.9% | 39.2% |
| Mean | 14.4% | 13.3% |
| Median | 9.3% | 12.7% |
| Interquartile 25% (IQ1) | 7.0% | 8.7% |
| Interquartile 75% (IQ3) | 18.6% | 15.9% |
| Interquartile Range (IQR) | 11.6% | 7.3% |
| Standard Deviation (Sample) | 13.9% | 8.0% |
| Standard Deviation (Population) | 13.6% | 7.8% |
Similar Demographics by Unemployment Among Seniors over 75 years
Demographics Similar to Africans by Unemployment Among Seniors over 75 years
In terms of unemployment among seniors over 75 years, the demographic groups most similar to Africans are Northern European (9.1%, a difference of 0.020%), Immigrants from Central America (9.1%, a difference of 0.020%), Yugoslavian (9.1%, a difference of 0.020%), Hispanic or Latino (9.1%, a difference of 0.030%), and Vietnamese (9.1%, a difference of 0.070%).
| Demographics | Rating | Rank | Unemployment Among Seniors over 75 years |
| Navajo | 6.1 /100 | #225 | Tragic 9.1% |
| Immigrants | Bangladesh | 5.9 /100 | #226 | Tragic 9.1% |
| Samoans | 5.7 /100 | #227 | Tragic 9.1% |
| Kenyans | 5.4 /100 | #228 | Tragic 9.1% |
| Hispanics or Latinos | 5.0 /100 | #229 | Tragic 9.1% |
| Northern Europeans | 4.9 /100 | #230 | Tragic 9.1% |
| Immigrants | Central America | 4.9 /100 | #231 | Tragic 9.1% |
| Africans | 4.9 /100 | #232 | Tragic 9.1% |
| Yugoslavians | 4.8 /100 | #233 | Tragic 9.1% |
| Vietnamese | 4.6 /100 | #234 | Tragic 9.1% |
| Panamanians | 4.0 /100 | #235 | Tragic 9.1% |
| Jordanians | 4.0 /100 | #236 | Tragic 9.1% |
| Houma | 3.9 /100 | #237 | Tragic 9.1% |
| Inupiat | 3.6 /100 | #238 | Tragic 9.1% |
| Mexicans | 3.5 /100 | #239 | Tragic 9.1% |
Demographics Similar to West Indians by Unemployment Among Seniors over 75 years
In terms of unemployment among seniors over 75 years, the demographic groups most similar to West Indians are Immigrants from Italy (8.8%, a difference of 0.010%), Immigrants from Somalia (8.8%, a difference of 0.010%), Central American (8.8%, a difference of 0.080%), Immigrants from Thailand (8.8%, a difference of 0.090%), and Guatemalan (8.8%, a difference of 0.13%).
| Demographics | Rating | Rank | Unemployment Among Seniors over 75 years |
| Dominicans | 51.9 /100 | #171 | Average 8.7% |
| Immigrants | Immigrants | 51.8 /100 | #172 | Average 8.7% |
| Australians | 50.3 /100 | #173 | Average 8.7% |
| Immigrants | El Salvador | 49.7 /100 | #174 | Average 8.7% |
| Syrians | 49.6 /100 | #175 | Average 8.7% |
| Somalis | 45.3 /100 | #176 | Average 8.8% |
| Central Americans | 43.3 /100 | #177 | Average 8.8% |
| West Indians | 41.9 /100 | #178 | Average 8.8% |
| Immigrants | Italy | 41.7 /100 | #179 | Average 8.8% |
| Immigrants | Somalia | 41.7 /100 | #180 | Average 8.8% |
| Immigrants | Thailand | 40.2 /100 | #181 | Average 8.8% |
| Guatemalans | 39.5 /100 | #182 | Fair 8.8% |
| Immigrants | Afghanistan | 38.2 /100 | #183 | Fair 8.8% |
| Immigrants | Micronesia | 37.2 /100 | #184 | Fair 8.8% |
| Choctaw | 37.1 /100 | #185 | Fair 8.8% |