Tongan vs Immigrants from Zaire Female Poverty Among 18-24 Year Olds
COMPARE
Tongan
Immigrants from Zaire
Female Poverty Among 18-24 Year Olds
Female Poverty Among 18-24 Year Olds Comparison
Tongans
Immigrants from Zaire
17.1%
FEMALE POVERTY AMONG 18-24 YEAR OLDS
100.0/ 100
METRIC RATING
14th/ 347
METRIC RANK
25.1%
FEMALE POVERTY AMONG 18-24 YEAR OLDS
0.0/ 100
METRIC RATING
321st/ 347
METRIC RANK
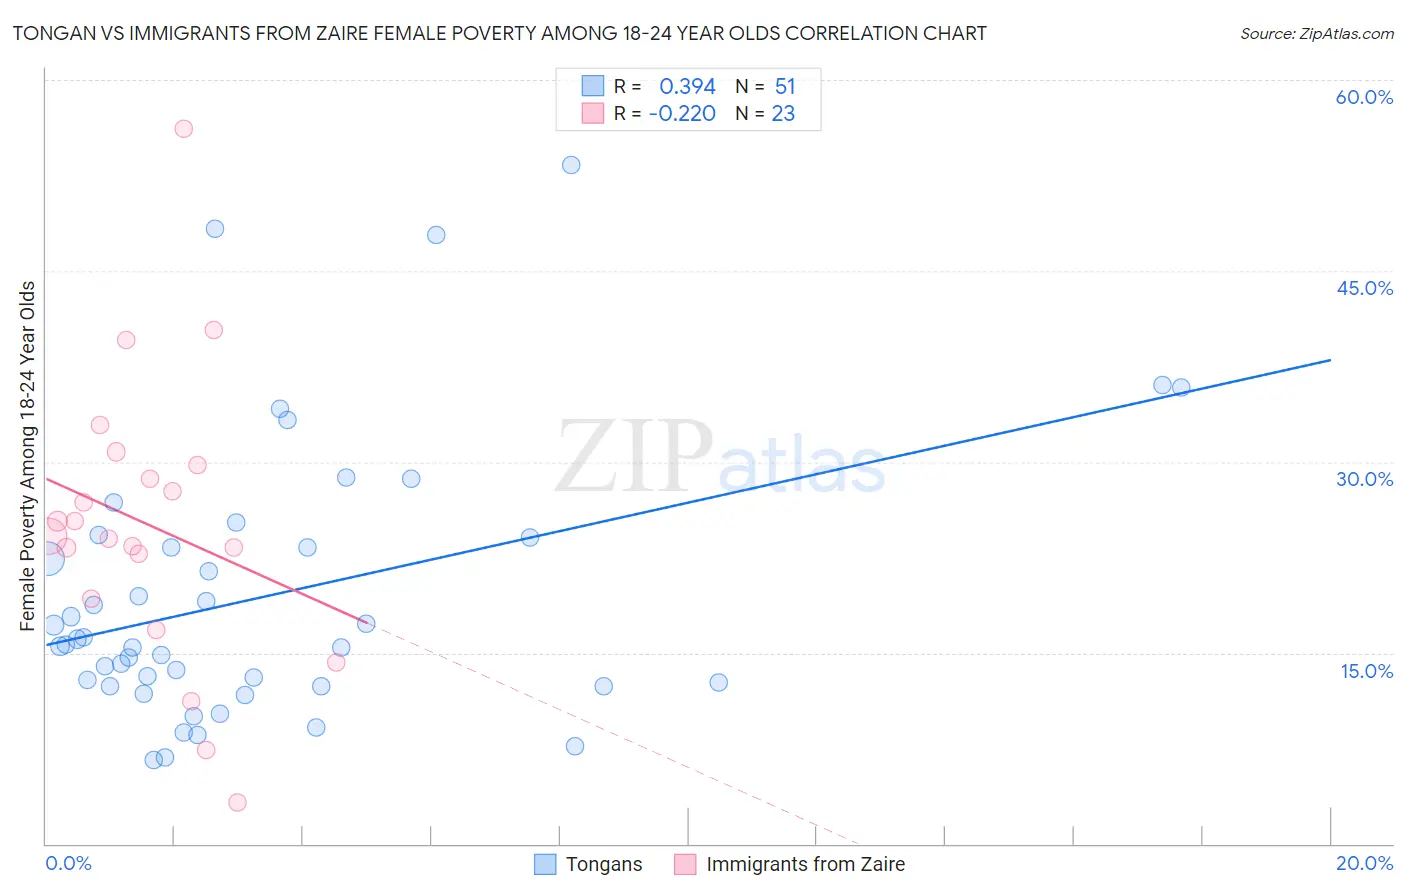
Tongan vs Immigrants from Zaire Female Poverty Among 18-24 Year Olds Correlation Chart
The statistical analysis conducted on geographies consisting of 102,459,978 people shows a mild positive correlation between the proportion of Tongans and poverty level among females between the ages 18 and 24 in the United States with a correlation coefficient (R) of 0.394 and weighted average of 17.1%. Similarly, the statistical analysis conducted on geographies consisting of 106,901,592 people shows a weak negative correlation between the proportion of Immigrants from Zaire and poverty level among females between the ages 18 and 24 in the United States with a correlation coefficient (R) of -0.220 and weighted average of 25.1%, a difference of 46.3%.
Female Poverty Among 18-24 Year Olds Correlation Summary
| Measurement | Tongan | Immigrants from Zaire |
| Minimum | 6.6% | 3.2% |
| Maximum | 53.3% | 56.1% |
| Range | 46.8% | 52.9% |
| Mean | 19.5% | 25.1% |
| Median | 15.7% | 24.1% |
| Interquartile 25% (IQ1) | 12.4% | 19.2% |
| Interquartile 75% (IQ3) | 24.1% | 29.7% |
| Interquartile Range (IQR) | 11.6% | 10.5% |
| Standard Deviation (Sample) | 10.7% | 11.2% |
| Standard Deviation (Population) | 10.6% | 11.0% |
Similar Demographics by Female Poverty Among 18-24 Year Olds
Demographics Similar to Tongans by Female Poverty Among 18-24 Year Olds
In terms of female poverty among 18-24 year olds, the demographic groups most similar to Tongans are Immigrants from Poland (17.1%, a difference of 0.17%), Cuban (17.2%, a difference of 0.28%), Peruvian (17.2%, a difference of 0.51%), Immigrants from Taiwan (17.3%, a difference of 0.75%), and Immigrants from Pakistan (17.0%, a difference of 0.83%).
| Demographics | Rating | Rank | Female Poverty Among 18-24 Year Olds |
| Immigrants | Azores | 100.0 /100 | #7 | Exceptional 16.7% |
| Immigrants | Bolivia | 100.0 /100 | #8 | Exceptional 16.7% |
| Immigrants | Peru | 100.0 /100 | #9 | Exceptional 16.9% |
| Koreans | 100.0 /100 | #10 | Exceptional 16.9% |
| Thais | 100.0 /100 | #11 | Exceptional 17.0% |
| Immigrants | Pakistan | 100.0 /100 | #12 | Exceptional 17.0% |
| Immigrants | Poland | 100.0 /100 | #13 | Exceptional 17.1% |
| Tongans | 100.0 /100 | #14 | Exceptional 17.1% |
| Cubans | 100.0 /100 | #15 | Exceptional 17.2% |
| Peruvians | 100.0 /100 | #16 | Exceptional 17.2% |
| Immigrants | Taiwan | 100.0 /100 | #17 | Exceptional 17.3% |
| Immigrants | Colombia | 100.0 /100 | #18 | Exceptional 17.3% |
| Immigrants | Lithuania | 100.0 /100 | #19 | Exceptional 17.4% |
| Immigrants | Venezuela | 100.0 /100 | #20 | Exceptional 17.4% |
| Bolivians | 100.0 /100 | #21 | Exceptional 17.4% |
Demographics Similar to Immigrants from Zaire by Female Poverty Among 18-24 Year Olds
In terms of female poverty among 18-24 year olds, the demographic groups most similar to Immigrants from Zaire are Somali (25.1%, a difference of 0.30%), Arapaho (25.2%, a difference of 0.37%), German Russian (25.2%, a difference of 0.40%), Immigrants from Saudi Arabia (25.3%, a difference of 0.83%), and Yakama (25.3%, a difference of 1.1%).
| Demographics | Rating | Rank | Female Poverty Among 18-24 Year Olds |
| Choctaw | 0.0 /100 | #314 | Tragic 24.3% |
| Blacks/African Americans | 0.0 /100 | #315 | Tragic 24.3% |
| Alsatians | 0.0 /100 | #316 | Tragic 24.4% |
| Osage | 0.0 /100 | #317 | Tragic 24.5% |
| Chickasaw | 0.0 /100 | #318 | Tragic 24.5% |
| Dutch West Indians | 0.0 /100 | #319 | Tragic 24.5% |
| Immigrants | Congo | 0.0 /100 | #320 | Tragic 24.6% |
| Immigrants | Zaire | 0.0 /100 | #321 | Tragic 25.1% |
| Somalis | 0.0 /100 | #322 | Tragic 25.1% |
| Arapaho | 0.0 /100 | #323 | Tragic 25.2% |
| German Russians | 0.0 /100 | #324 | Tragic 25.2% |
| Immigrants | Saudi Arabia | 0.0 /100 | #325 | Tragic 25.3% |
| Yakama | 0.0 /100 | #326 | Tragic 25.3% |
| Ute | 0.0 /100 | #327 | Tragic 25.4% |
| Natives/Alaskans | 0.0 /100 | #328 | Tragic 25.4% |