Yuman vs Scandinavian Female Poverty
COMPARE
Yuman
Scandinavian
Female Poverty
Female Poverty Comparison
Yuman
Scandinavians
20.8%
FEMALE POVERTY
0.0/ 100
METRIC RATING
337th/ 347
METRIC RANK
12.1%
FEMALE POVERTY
98.2/ 100
METRIC RATING
58th/ 347
METRIC RANK
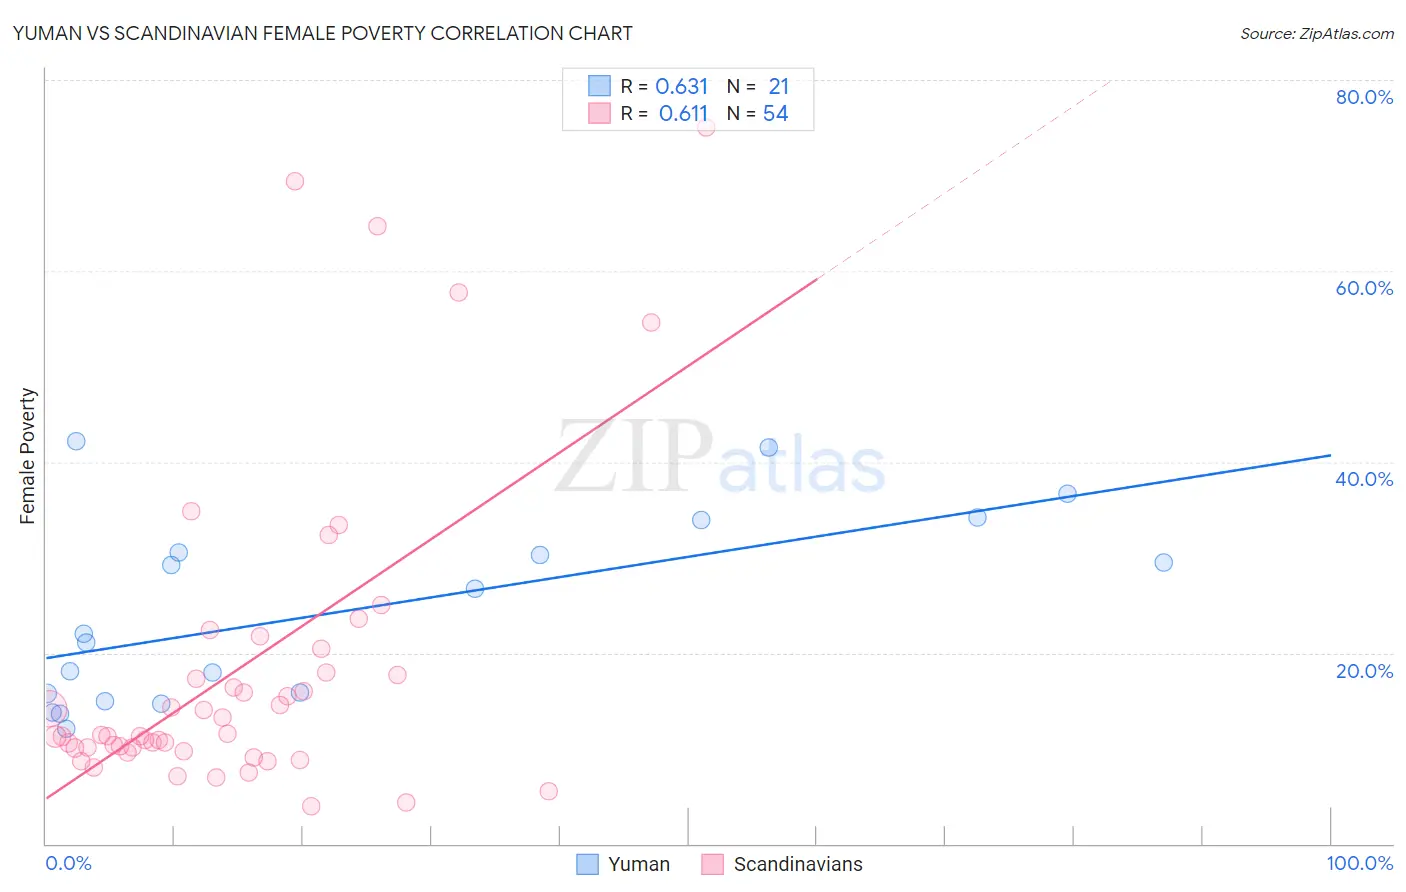
Yuman vs Scandinavian Female Poverty Correlation Chart
The statistical analysis conducted on geographies consisting of 40,663,290 people shows a significant positive correlation between the proportion of Yuman and poverty level among females in the United States with a correlation coefficient (R) of 0.631 and weighted average of 20.8%. Similarly, the statistical analysis conducted on geographies consisting of 472,075,178 people shows a significant positive correlation between the proportion of Scandinavians and poverty level among females in the United States with a correlation coefficient (R) of 0.611 and weighted average of 12.1%, a difference of 71.7%.
Female Poverty Correlation Summary
| Measurement | Yuman | Scandinavian |
| Minimum | 12.1% | 3.9% |
| Maximum | 42.1% | 75.0% |
| Range | 30.1% | 71.1% |
| Mean | 24.5% | 18.4% |
| Median | 22.0% | 11.3% |
| Interquartile 25% (IQ1) | 15.3% | 10.0% |
| Interquartile 75% (IQ3) | 32.2% | 18.0% |
| Interquartile Range (IQR) | 16.8% | 7.9% |
| Standard Deviation (Sample) | 9.7% | 16.4% |
| Standard Deviation (Population) | 9.5% | 16.2% |
Similar Demographics by Female Poverty
Demographics Similar to Yuman by Female Poverty
In terms of female poverty, the demographic groups most similar to Yuman are Sioux (20.9%, a difference of 0.19%), Hopi (21.0%, a difference of 0.56%), Pueblo (20.7%, a difference of 0.81%), Yup'ik (21.5%, a difference of 3.1%), and Cheyenne (20.2%, a difference of 3.2%).
| Demographics | Rating | Rank | Female Poverty |
| Dominicans | 0.0 /100 | #330 | Tragic 19.1% |
| Natives/Alaskans | 0.0 /100 | #331 | Tragic 19.2% |
| Apache | 0.0 /100 | #332 | Tragic 19.2% |
| Immigrants | Dominican Republic | 0.0 /100 | #333 | Tragic 19.3% |
| Houma | 0.0 /100 | #334 | Tragic 20.0% |
| Cheyenne | 0.0 /100 | #335 | Tragic 20.2% |
| Pueblo | 0.0 /100 | #336 | Tragic 20.7% |
| Yuman | 0.0 /100 | #337 | Tragic 20.8% |
| Sioux | 0.0 /100 | #338 | Tragic 20.9% |
| Hopi | 0.0 /100 | #339 | Tragic 21.0% |
| Yup'ik | 0.0 /100 | #340 | Tragic 21.5% |
| Crow | 0.0 /100 | #341 | Tragic 22.1% |
| Immigrants | Yemen | 0.0 /100 | #342 | Tragic 22.8% |
| Lumbee | 0.0 /100 | #343 | Tragic 23.5% |
| Pima | 0.0 /100 | #344 | Tragic 23.6% |
Demographics Similar to Scandinavians by Female Poverty
In terms of female poverty, the demographic groups most similar to Scandinavians are Immigrants from Europe (12.1%, a difference of 0.010%), Immigrants from Serbia (12.1%, a difference of 0.080%), Estonian (12.1%, a difference of 0.14%), Immigrants from Australia (12.2%, a difference of 0.25%), and Immigrants from Asia (12.2%, a difference of 0.26%).
| Demographics | Rating | Rank | Female Poverty |
| Immigrants | Bulgaria | 98.9 /100 | #51 | Exceptional 12.0% |
| Immigrants | Croatia | 98.7 /100 | #52 | Exceptional 12.0% |
| Immigrants | Austria | 98.7 /100 | #53 | Exceptional 12.0% |
| Immigrants | Philippines | 98.7 /100 | #54 | Exceptional 12.1% |
| Immigrants | Sri Lanka | 98.5 /100 | #55 | Exceptional 12.1% |
| Estonians | 98.3 /100 | #56 | Exceptional 12.1% |
| Immigrants | Serbia | 98.3 /100 | #57 | Exceptional 12.1% |
| Scandinavians | 98.2 /100 | #58 | Exceptional 12.1% |
| Immigrants | Europe | 98.2 /100 | #59 | Exceptional 12.1% |
| Immigrants | Australia | 98.1 /100 | #60 | Exceptional 12.2% |
| Immigrants | Asia | 98.1 /100 | #61 | Exceptional 12.2% |
| Immigrants | Italy | 98.0 /100 | #62 | Exceptional 12.2% |
| Ukrainians | 98.0 /100 | #63 | Exceptional 12.2% |
| Germans | 98.0 /100 | #64 | Exceptional 12.2% |
| Indians (Asian) | 97.9 /100 | #65 | Exceptional 12.2% |