Yuman vs Scandinavian 12th Grade, No Diploma
COMPARE
Yuman
Scandinavian
12th Grade, No Diploma
12th Grade, No Diploma Comparison
Yuman
Scandinavians
86.5%
12TH GRADE, NO DIPLOMA
0.0/ 100
METRIC RATING
323rd/ 347
METRIC RANK
93.2%
12TH GRADE, NO DIPLOMA
99.9/ 100
METRIC RATING
23rd/ 347
METRIC RANK
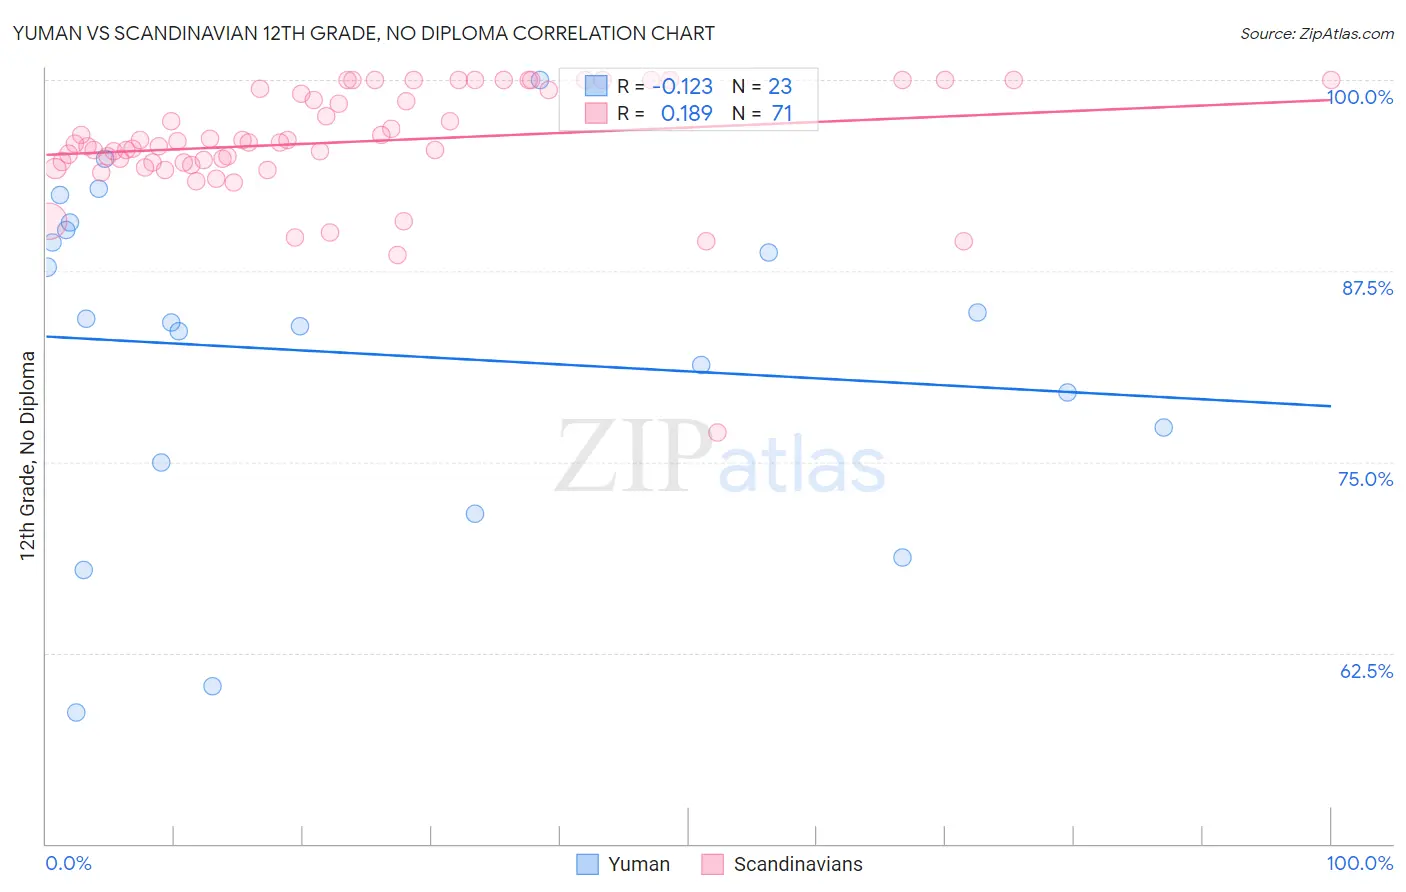
Yuman vs Scandinavian 12th Grade, No Diploma Correlation Chart
The statistical analysis conducted on geographies consisting of 40,696,349 people shows a poor negative correlation between the proportion of Yuman and percentage of population with at least 12th grade (no diploma) education in the United States with a correlation coefficient (R) of -0.123 and weighted average of 86.5%. Similarly, the statistical analysis conducted on geographies consisting of 472,659,370 people shows a poor positive correlation between the proportion of Scandinavians and percentage of population with at least 12th grade (no diploma) education in the United States with a correlation coefficient (R) of 0.189 and weighted average of 93.2%, a difference of 7.8%.
12th Grade, No Diploma Correlation Summary
| Measurement | Yuman | Scandinavian |
| Minimum | 58.6% | 76.9% |
| Maximum | 100.0% | 100.0% |
| Range | 41.4% | 23.1% |
| Mean | 82.1% | 95.9% |
| Median | 84.1% | 95.9% |
| Interquartile 25% (IQ1) | 74.9% | 94.6% |
| Interquartile 75% (IQ3) | 90.2% | 99.5% |
| Interquartile Range (IQR) | 15.3% | 4.9% |
| Standard Deviation (Sample) | 10.9% | 3.8% |
| Standard Deviation (Population) | 10.6% | 3.8% |
Similar Demographics by 12th Grade, No Diploma
Demographics Similar to Yuman by 12th Grade, No Diploma
In terms of 12th grade, no diploma, the demographic groups most similar to Yuman are Central American Indian (86.5%, a difference of 0.0%), Puerto Rican (86.5%, a difference of 0.080%), Immigrants from Nicaragua (86.6%, a difference of 0.11%), Immigrants from Belize (87.0%, a difference of 0.57%), and Belizean (87.0%, a difference of 0.65%).
| Demographics | Rating | Rank | 12th Grade, No Diploma |
| Apache | 0.0 /100 | #316 | Tragic 87.3% |
| Navajo | 0.0 /100 | #317 | Tragic 87.1% |
| Belizeans | 0.0 /100 | #318 | Tragic 87.0% |
| Immigrants | Belize | 0.0 /100 | #319 | Tragic 87.0% |
| Immigrants | Nicaragua | 0.0 /100 | #320 | Tragic 86.6% |
| Puerto Ricans | 0.0 /100 | #321 | Tragic 86.5% |
| Central American Indians | 0.0 /100 | #322 | Tragic 86.5% |
| Yuman | 0.0 /100 | #323 | Tragic 86.5% |
| Immigrants | Cabo Verde | 0.0 /100 | #324 | Tragic 85.8% |
| Mexican American Indians | 0.0 /100 | #325 | Tragic 85.7% |
| Dominicans | 0.0 /100 | #326 | Tragic 85.7% |
| Lumbee | 0.0 /100 | #327 | Tragic 85.7% |
| Hondurans | 0.0 /100 | #328 | Tragic 85.5% |
| Hispanics or Latinos | 0.0 /100 | #329 | Tragic 85.4% |
| Immigrants | Azores | 0.0 /100 | #330 | Tragic 85.3% |
Demographics Similar to Scandinavians by 12th Grade, No Diploma
In terms of 12th grade, no diploma, the demographic groups most similar to Scandinavians are Estonian (93.2%, a difference of 0.010%), Thai (93.2%, a difference of 0.010%), Italian (93.2%, a difference of 0.020%), Czech (93.2%, a difference of 0.030%), and Filipino (93.2%, a difference of 0.040%).
| Demographics | Rating | Rank | 12th Grade, No Diploma |
| Maltese | 100.0 /100 | #16 | Exceptional 93.3% |
| Luxembourgers | 100.0 /100 | #17 | Exceptional 93.3% |
| Immigrants | Singapore | 99.9 /100 | #18 | Exceptional 93.3% |
| Germans | 99.9 /100 | #19 | Exceptional 93.3% |
| Filipinos | 99.9 /100 | #20 | Exceptional 93.2% |
| Italians | 99.9 /100 | #21 | Exceptional 93.2% |
| Estonians | 99.9 /100 | #22 | Exceptional 93.2% |
| Scandinavians | 99.9 /100 | #23 | Exceptional 93.2% |
| Thais | 99.9 /100 | #24 | Exceptional 93.2% |
| Czechs | 99.9 /100 | #25 | Exceptional 93.2% |
| Russians | 99.9 /100 | #26 | Exceptional 93.2% |
| Cypriots | 99.9 /100 | #27 | Exceptional 93.1% |
| Immigrants | Northern Europe | 99.9 /100 | #28 | Exceptional 93.1% |
| Iranians | 99.9 /100 | #29 | Exceptional 93.1% |
| Immigrants | Lithuania | 99.9 /100 | #30 | Exceptional 93.1% |