Immigrants from Central America vs Scandinavian Female Poverty
COMPARE
Immigrants from Central America
Scandinavian
Female Poverty
Female Poverty Comparison
Immigrants from Central America
Scandinavians
16.8%
FEMALE POVERTY
0.0/ 100
METRIC RATING
304th/ 347
METRIC RANK
12.1%
FEMALE POVERTY
98.2/ 100
METRIC RATING
58th/ 347
METRIC RANK
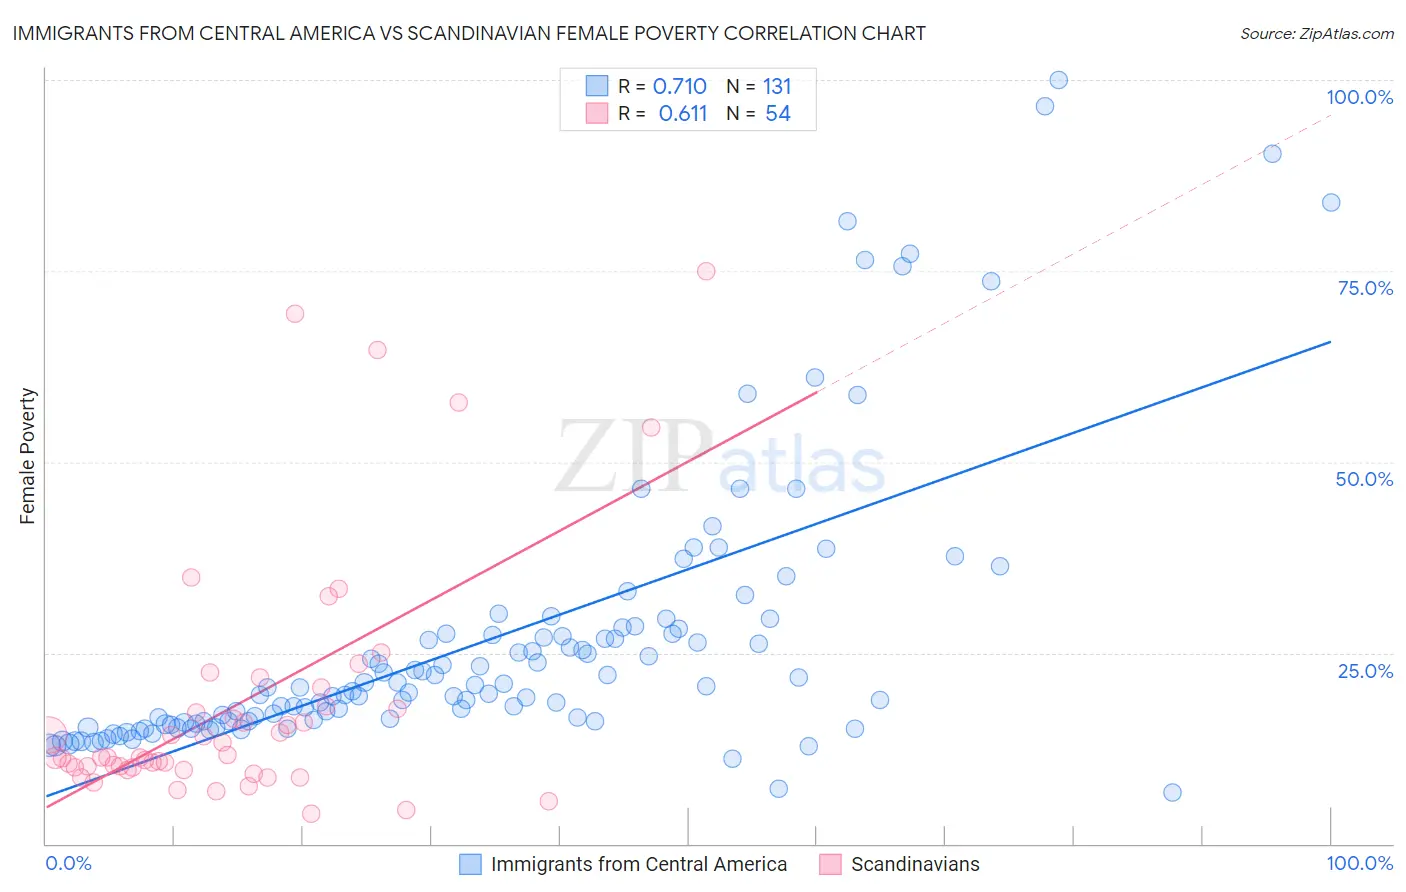
Immigrants from Central America vs Scandinavian Female Poverty Correlation Chart
The statistical analysis conducted on geographies consisting of 535,791,715 people shows a strong positive correlation between the proportion of Immigrants from Central America and poverty level among females in the United States with a correlation coefficient (R) of 0.710 and weighted average of 16.8%. Similarly, the statistical analysis conducted on geographies consisting of 472,075,178 people shows a significant positive correlation between the proportion of Scandinavians and poverty level among females in the United States with a correlation coefficient (R) of 0.611 and weighted average of 12.1%, a difference of 38.5%.
Female Poverty Correlation Summary
| Measurement | Immigrants from Central America | Scandinavian |
| Minimum | 6.7% | 3.9% |
| Maximum | 100.0% | 75.0% |
| Range | 93.3% | 71.1% |
| Mean | 26.7% | 18.4% |
| Median | 20.4% | 11.3% |
| Interquartile 25% (IQ1) | 16.0% | 10.0% |
| Interquartile 75% (IQ3) | 27.6% | 18.0% |
| Interquartile Range (IQR) | 11.5% | 7.9% |
| Standard Deviation (Sample) | 18.5% | 16.4% |
| Standard Deviation (Population) | 18.4% | 16.2% |
Similar Demographics by Female Poverty
Demographics Similar to Immigrants from Central America by Female Poverty
In terms of female poverty, the demographic groups most similar to Immigrants from Central America are Immigrants from Grenada (16.8%, a difference of 0.0%), Choctaw (16.8%, a difference of 0.060%), Immigrants from Caribbean (16.9%, a difference of 0.27%), Seminole (16.9%, a difference of 0.40%), and African (16.9%, a difference of 0.46%).
| Demographics | Rating | Rank | Female Poverty |
| Mexicans | 0.0 /100 | #297 | Tragic 16.5% |
| Somalis | 0.0 /100 | #298 | Tragic 16.6% |
| Hispanics or Latinos | 0.0 /100 | #299 | Tragic 16.6% |
| Bahamians | 0.0 /100 | #300 | Tragic 16.6% |
| Guatemalans | 0.0 /100 | #301 | Tragic 16.7% |
| Chippewa | 0.0 /100 | #302 | Tragic 16.7% |
| Choctaw | 0.0 /100 | #303 | Tragic 16.8% |
| Immigrants | Central America | 0.0 /100 | #304 | Tragic 16.8% |
| Immigrants | Grenada | 0.0 /100 | #305 | Tragic 16.8% |
| Immigrants | Caribbean | 0.0 /100 | #306 | Tragic 16.9% |
| Seminole | 0.0 /100 | #307 | Tragic 16.9% |
| Africans | 0.0 /100 | #308 | Tragic 16.9% |
| Immigrants | Mexico | 0.0 /100 | #309 | Tragic 17.0% |
| Creek | 0.0 /100 | #310 | Tragic 17.0% |
| Immigrants | Guatemala | 0.0 /100 | #311 | Tragic 17.0% |
Demographics Similar to Scandinavians by Female Poverty
In terms of female poverty, the demographic groups most similar to Scandinavians are Immigrants from Europe (12.1%, a difference of 0.010%), Immigrants from Serbia (12.1%, a difference of 0.080%), Estonian (12.1%, a difference of 0.14%), Immigrants from Australia (12.2%, a difference of 0.25%), and Immigrants from Asia (12.2%, a difference of 0.26%).
| Demographics | Rating | Rank | Female Poverty |
| Immigrants | Bulgaria | 98.9 /100 | #51 | Exceptional 12.0% |
| Immigrants | Croatia | 98.7 /100 | #52 | Exceptional 12.0% |
| Immigrants | Austria | 98.7 /100 | #53 | Exceptional 12.0% |
| Immigrants | Philippines | 98.7 /100 | #54 | Exceptional 12.1% |
| Immigrants | Sri Lanka | 98.5 /100 | #55 | Exceptional 12.1% |
| Estonians | 98.3 /100 | #56 | Exceptional 12.1% |
| Immigrants | Serbia | 98.3 /100 | #57 | Exceptional 12.1% |
| Scandinavians | 98.2 /100 | #58 | Exceptional 12.1% |
| Immigrants | Europe | 98.2 /100 | #59 | Exceptional 12.1% |
| Immigrants | Australia | 98.1 /100 | #60 | Exceptional 12.2% |
| Immigrants | Asia | 98.1 /100 | #61 | Exceptional 12.2% |
| Immigrants | Italy | 98.0 /100 | #62 | Exceptional 12.2% |
| Ukrainians | 98.0 /100 | #63 | Exceptional 12.2% |
| Germans | 98.0 /100 | #64 | Exceptional 12.2% |
| Indians (Asian) | 97.9 /100 | #65 | Exceptional 12.2% |