Yuman vs Lithuanian Single Mother Poverty

COMPARE

Yuman
Race
Ancestry
AfghanAfricanAlaska NativeAlaskan AthabascanAlbanianAleutAlsatianAmericanApacheArabArapahoArgentineanArmenianAssyrian/Chaldean/SyriacAustralianAustrianBahamianBangladeshiBarbadianBasqueBelgianBelizeanBermudanBhutaneseBlackfeetBolivianBrazilianBritishBritish West IndianBulgarianBurmeseCajunCambodianCanadianCape VerdeanCarpatho RusynCelticCentral AmericanCentral American IndianCherokeeCheyenneChickasawChileanChineseChippewaChoctawColombianColvilleComancheCosta RicanCreeCreekCroatianCrowCubanCypriotCzechCzechoslovakianDanishDelawareDominicanDutchDutch West IndianEastern EuropeanEcuadorianEgyptianEnglishEstonianEthiopianEuropeanFijianFilipinoFinnishFrenchFrench American IndianFrench CanadianGermanGerman RussianGhanaianGreekGuamanian/ChamorroGuatemalanGuyaneseHaitianHmongHonduranHopiHoumaHungarianIcelanderIndian (Asian)IndonesianInupiatIranianIraqiIrishIroquoisIsraeliItalianJamaicanJapaneseJordanianKenyanKiowaKoreanLaotianLatvianLebaneseLiberianLumbeeLuxembourgerMacedonianMalaysianMalteseMarshalleseMenomineeMexicanMexican American IndianMongolianMoroccanNative HawaiianNavajoNepaleseNew ZealanderNicaraguanNigerianNorthern EuropeanNorwegianOkinawanOsageOttawaPaiutePakistaniPalestinianPanamanianParaguayanPennsylvania GermanPeruvianPimaPolishPortuguesePotawatomiPuebloPuerto RicanPuget Sound SalishRomanianRussianSalvadoranSamoanScandinavianScotch-IrishScottishSeminoleSenegaleseSerbianShoshoneSierra LeoneanSiouxSlavicSlovakSloveneSomaliSouth AfricanSouth AmericanSouth American IndianSoviet UnionSpaniardSpanishSpanish AmericanSpanish American IndianSri LankanSubsaharan AfricanSudaneseSwedishSwissSyrianTaiwaneseThaiTlingit-HaidaTohono O'OdhamTonganTrinidadian and TobagonianTsimshianTurkishU.S. Virgin IslanderUgandanUkrainianUruguayanUteVenezuelanVietnameseWelshWest IndianYakamaYaquiYugoslavianYumanYup'ikZimbabwean
Immigration
NonimmigrantsImmigrantsAfghanistanAfricaAlbaniaArgentinaArmeniaAsiaAustraliaAustriaBahamasBangladeshBarbadosBelarusBelgiumBelizeBoliviaBosnia and HerzegovinaBrazilBulgariaBurma/MyanmarCabo VerdeCambodiaCameroonCanadaCaribbeanCentral AmericaChileChinaColombiaCongoCosta RicaCroatiaCubaCzechoslovakiaDenmarkDominicaDominican RepublicEastern AfricaEastern AsiaEastern EuropeEcuadorEgyptEl SalvadorEnglandEritreaEthiopiaEuropeFijiFranceGermanyGhanaGreeceGrenadaGuatemalaGuyanaHaitiHondurasHong KongHungaryIndiaIndonesiaIranIraqIrelandIsraelItalyJamaicaJapanJordanKazakhstanKenyaKoreaKuwaitLaosLatin AmericaLatviaLebanonLiberiaLithuaniaMalaysiaMexicoMicronesiaMiddle AfricaMoldovaMoroccoNepalNetherlandsNicaraguaNigeriaNorth AmericaNorth MacedoniaNorthern AfricaNorthern EuropeNorwayOceaniaPakistanPanamaPeruPhilippinesPolandPortugalRomaniaRussiaSaudi ArabiaScotlandSenegalSerbiaSierra LeoneSingaporeSomaliaSouth AfricaSouth AmericaSouth Central AsiaSouth Eastern AsiaSouthern EuropeSpainSri LankaSt. Vincent and the GrenadinesSudanSwedenSwitzerlandSyriaTaiwanThailandTrinidad and TobagoTurkeyUgandaUkraineUruguayUzbekistanVenezuelaVietnamWest IndiesWestern AfricaWestern AsiaWestern EuropeYemenZaireZimbabweAzores
Lithuanian
Race
Ancestry
AfghanAfricanAlaska NativeAlaskan AthabascanAlbanianAleutAlsatianAmericanApacheArabArapahoArgentineanArmenianAssyrian/Chaldean/SyriacAustralianAustrianBahamianBangladeshiBarbadianBasqueBelgianBelizeanBermudanBhutaneseBlackfeetBolivianBrazilianBritishBritish West IndianBulgarianBurmeseCajunCambodianCanadianCape VerdeanCarpatho RusynCelticCentral AmericanCentral American IndianCherokeeCheyenneChickasawChileanChineseChippewaChoctawColombianColvilleComancheCosta RicanCreeCreekCroatianCrowCubanCypriotCzechCzechoslovakianDanishDelawareDominicanDutchDutch West IndianEastern EuropeanEcuadorianEgyptianEnglishEstonianEthiopianEuropeanFijianFilipinoFinnishFrenchFrench American IndianFrench CanadianGermanGerman RussianGhanaianGreekGuamanian/ChamorroGuatemalanGuyaneseHaitianHmongHonduranHopiHoumaHungarianIcelanderIndian (Asian)IndonesianInupiatIranianIraqiIrishIroquoisIsraeliItalianJamaicanJapaneseJordanianKenyanKiowaKoreanLaotianLatvianLebaneseLiberianLithuanianLumbeeLuxembourgerMacedonianMalaysianMalteseMarshalleseMenomineeMexicanMexican American IndianMongolianMoroccanNative HawaiianNavajoNepaleseNew ZealanderNicaraguanNigerianNorthern EuropeanNorwegianOkinawanOsageOttawaPaiutePakistaniPalestinianPanamanianParaguayanPennsylvania GermanPeruvianPimaPolishPortuguesePotawatomiPuebloPuerto RicanPuget Sound SalishRomanianRussianSalvadoranSamoanScandinavianScotch-IrishScottishSeminoleSenegaleseSerbianShoshoneSierra LeoneanSiouxSlavicSlovakSloveneSomaliSouth AfricanSouth AmericanSouth American IndianSoviet UnionSpaniardSpanishSpanish AmericanSpanish American IndianSri LankanSubsaharan AfricanSudaneseSwedishSwissSyrianTaiwaneseThaiTlingit-HaidaTohono O'OdhamTonganTrinidadian and TobagonianTsimshianTurkishU.S. Virgin IslanderUgandanUkrainianUruguayanUteVenezuelanVietnameseWelshWest IndianYakamaYaquiYugoslavianYup'ikZimbabwean
Immigration
NonimmigrantsImmigrantsAfghanistanAfricaAlbaniaArgentinaArmeniaAsiaAustraliaAustriaBahamasBangladeshBarbadosBelarusBelgiumBelizeBoliviaBosnia and HerzegovinaBrazilBulgariaBurma/MyanmarCabo VerdeCambodiaCameroonCanadaCaribbeanCentral AmericaChileChinaColombiaCongoCosta RicaCroatiaCubaCzechoslovakiaDenmarkDominicaDominican RepublicEastern AfricaEastern AsiaEastern EuropeEcuadorEgyptEl SalvadorEnglandEritreaEthiopiaEuropeFijiFranceGermanyGhanaGreeceGrenadaGuatemalaGuyanaHaitiHondurasHong KongHungaryIndiaIndonesiaIranIraqIrelandIsraelItalyJamaicaJapanJordanKazakhstanKenyaKoreaKuwaitLaosLatin AmericaLatviaLebanonLiberiaLithuaniaMalaysiaMexicoMicronesiaMiddle AfricaMoldovaMoroccoNepalNetherlandsNicaraguaNigeriaNorth AmericaNorth MacedoniaNorthern AfricaNorthern EuropeNorwayOceaniaPakistanPanamaPeruPhilippinesPolandPortugalRomaniaRussiaSaudi ArabiaScotlandSenegalSerbiaSierra LeoneSingaporeSomaliaSouth AfricaSouth AmericaSouth Central AsiaSouth Eastern AsiaSouthern EuropeSpainSri LankaSt. Vincent and the GrenadinesSudanSwedenSwitzerlandSyriaTaiwanThailandTrinidad and TobagoTurkeyUgandaUkraineUruguayUzbekistanVenezuelaVietnamWest IndiesWestern AfricaWestern AsiaWestern EuropeYemenZaireZimbabweAzores
Single Mother Poverty
Income
Poverty
Unemployment
Labor Participation
Family Structure
Vehicle Availability
Education Level
Disability

Single Mother Poverty Comparison

Yuman

Lithuanians

Tragic
Exceptional
37.8%
SINGLE MOTHER POVERTY
0.0/ 100
METRIC RATING
335th/ 347
METRIC RANK
27.4%
SINGLE MOTHER POVERTY
99.4/ 100
METRIC RATING
69th/ 347
METRIC RANK

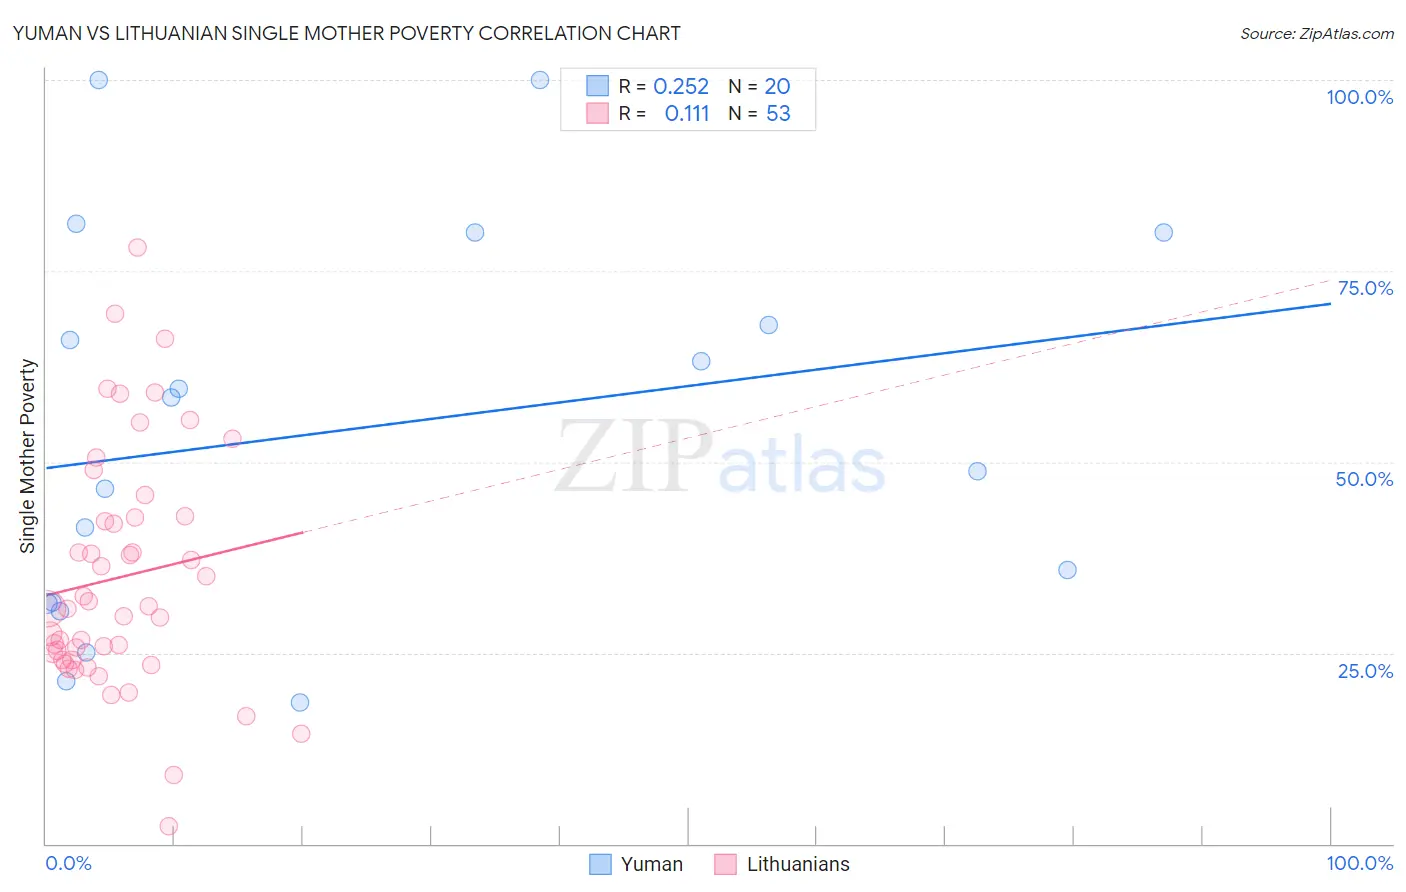
Yuman vs Lithuanian Single Mother Poverty Correlation Chart

The statistical analysis conducted on geographies consisting of 40,528,655 people shows a weak positive correlation between the proportion of Yuman and poverty level among single mothers in the United States with a correlation coefficient (R) of 0.252 and weighted average of 37.8%. Similarly, the statistical analysis conducted on geographies consisting of 407,174,767 people shows a poor positive correlation between the proportion of Lithuanians and poverty level among single mothers in the United States with a correlation coefficient (R) of 0.111 and weighted average of 27.4%, a difference of 37.9%.
Yuman vs Lithuanian Single Mother Poverty

Single Mother Poverty Correlation Summary

MeasurementYumanLithuanian
Minimum18.5%2.2%
Maximum100.0%78.1%
Range81.5%75.9%
Mean54.4%34.9%
Median53.5%30.8%
Interquartile 25% (IQ1)31.5%24.1%
Interquartile 75% (IQ3)74.0%42.8%
Interquartile Range (IQR)42.5%18.7%
Standard Deviation (Sample)25.2%15.6%
Standard Deviation (Population)24.6%15.5%

Similar Demographics by Single Mother Poverty

Demographics Similar to Yuman by Single Mother Poverty

In terms of single mother poverty, the demographic groups most similar to Yuman are Pueblo (37.2%, a difference of 1.5%), Menominee (37.1%, a difference of 1.9%), Cheyenne (38.5%, a difference of 1.9%), Immigrants from Yemen (38.5%, a difference of 2.0%), and Pima (38.6%, a difference of 2.2%).
DemographicsRating | RankSingle Mother Poverty
Choctaw
0.0
/100
|
#328
Tragic
36.4%
Apache
0.0
/100
|
#329
Tragic
36.6%
Natives/Alaskans
0.0
/100
|
#330
Tragic
36.6%
Creek
0.0
/100
|
#331
Tragic
36.7%
Dutch West Indians
0.0
/100
|
#332
Tragic
36.8%
Menominee
0.0
/100
|
#333
Tragic
37.1%
Pueblo
0.0
/100
|
#334
Tragic
37.2%
Yuman
0.0
/100
|
#335
Tragic
37.8%
Cheyenne
0.0
/100
|
#336
Tragic
38.5%
Immigrants | Yemen
0.0
/100
|
#337
Tragic
38.5%
Pima
0.0
/100
|
#338
Tragic
38.6%
Crow
0.0
/100
|
#339
Tragic
38.6%
Sioux
0.0
/100
|
#340
Tragic
38.8%
Colville
0.0
/100
|
#341
Tragic
39.3%
Navajo
0.0
/100
|
#342
Tragic
40.2%

Demographics Similar to Lithuanians by Single Mother Poverty

In terms of single mother poverty, the demographic groups most similar to Lithuanians are Immigrants from Belarus (27.4%, a difference of 0.010%), Macedonian (27.4%, a difference of 0.030%), Immigrants from Russia (27.4%, a difference of 0.060%), Sierra Leonean (27.4%, a difference of 0.12%), and Immigrants from Czechoslovakia (27.4%, a difference of 0.16%).
DemographicsRating | RankSingle Mother Poverty
Immigrants | Malaysia
99.5
/100
|
#62
Exceptional
27.3%
Immigrants | Northern Europe
99.5
/100
|
#63
Exceptional
27.3%
Russians
99.5
/100
|
#64
Exceptional
27.3%
Immigrants | Turkey
99.5
/100
|
#65
Exceptional
27.3%
Soviet Union
99.5
/100
|
#66
Exceptional
27.3%
Immigrants | Australia
99.5
/100
|
#67
Exceptional
27.3%
Immigrants | Czechoslovakia
99.5
/100
|
#68
Exceptional
27.4%
Lithuanians
99.4
/100
|
#69
Exceptional
27.4%
Immigrants | Belarus
99.4
/100
|
#70
Exceptional
27.4%
Macedonians
99.4
/100
|
#71
Exceptional
27.4%
Immigrants | Russia
99.4
/100
|
#72
Exceptional
27.4%
Sierra Leoneans
99.3
/100
|
#73
Exceptional
27.4%
Immigrants | Europe
99.3
/100
|
#74
Exceptional
27.4%
Immigrants | Sweden
99.2
/100
|
#75
Exceptional
27.5%
Peruvians
99.2
/100
|
#76
Exceptional
27.5%