Yuman vs Lithuanian 4th Grade
COMPARE
Yuman
Lithuanian
4th Grade
4th Grade Comparison
Yuman
Lithuanians
97.2%
4TH GRADE
2.9/ 100
METRIC RATING
235th/ 347
METRIC RANK
98.3%
4TH GRADE
100.0/ 100
METRIC RATING
21st/ 347
METRIC RANK
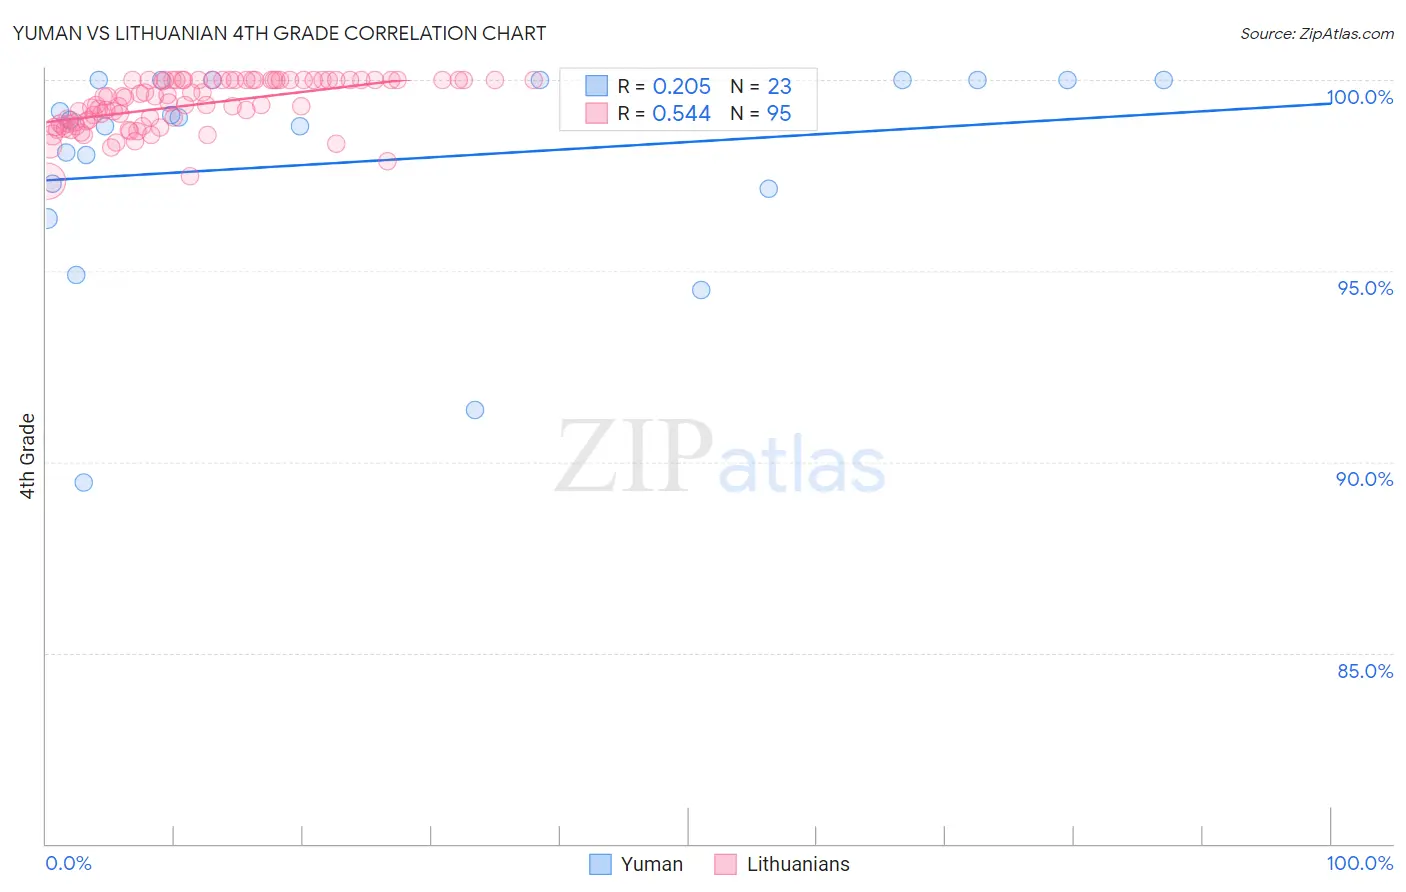
Yuman vs Lithuanian 4th Grade Correlation Chart
The statistical analysis conducted on geographies consisting of 40,696,349 people shows a weak positive correlation between the proportion of Yuman and percentage of population with at least 4th grade education in the United States with a correlation coefficient (R) of 0.205 and weighted average of 97.2%. Similarly, the statistical analysis conducted on geographies consisting of 421,946,231 people shows a substantial positive correlation between the proportion of Lithuanians and percentage of population with at least 4th grade education in the United States with a correlation coefficient (R) of 0.544 and weighted average of 98.3%, a difference of 1.2%.
4th Grade Correlation Summary
| Measurement | Yuman | Lithuanian |
| Minimum | 89.5% | 97.4% |
| Maximum | 100.0% | 100.0% |
| Range | 10.5% | 2.6% |
| Mean | 97.9% | 99.3% |
| Median | 99.0% | 99.4% |
| Interquartile 25% (IQ1) | 97.2% | 98.8% |
| Interquartile 75% (IQ3) | 100.0% | 100.0% |
| Interquartile Range (IQR) | 2.8% | 1.2% |
| Standard Deviation (Sample) | 2.9% | 0.65% |
| Standard Deviation (Population) | 2.8% | 0.65% |
Similar Demographics by 4th Grade
Demographics Similar to Yuman by 4th Grade
In terms of 4th grade, the demographic groups most similar to Yuman are Assyrian/Chaldean/Syriac (97.2%, a difference of 0.0%), Immigrants from Western Asia (97.2%, a difference of 0.010%), Senegalese (97.2%, a difference of 0.010%), Immigrants from Eastern Asia (97.2%, a difference of 0.010%), and Subsaharan African (97.2%, a difference of 0.020%).
| Demographics | Rating | Rank | 4th Grade |
| Sub-Saharan Africans | 3.6 /100 | #228 | Tragic 97.2% |
| Liberians | 3.6 /100 | #229 | Tragic 97.2% |
| Uruguayans | 3.5 /100 | #230 | Tragic 97.2% |
| Immigrants | Malaysia | 3.4 /100 | #231 | Tragic 97.2% |
| Immigrants | Western Asia | 3.4 /100 | #232 | Tragic 97.2% |
| Senegalese | 3.1 /100 | #233 | Tragic 97.2% |
| Assyrians/Chaldeans/Syriacs | 3.0 /100 | #234 | Tragic 97.2% |
| Yuman | 2.9 /100 | #235 | Tragic 97.2% |
| Immigrants | Eastern Asia | 2.7 /100 | #236 | Tragic 97.2% |
| Immigrants | Costa Rica | 2.0 /100 | #237 | Tragic 97.2% |
| Indians (Asian) | 1.9 /100 | #238 | Tragic 97.2% |
| Nigerians | 1.8 /100 | #239 | Tragic 97.1% |
| Colombians | 1.6 /100 | #240 | Tragic 97.1% |
| Immigrants | Indonesia | 1.5 /100 | #241 | Tragic 97.1% |
| Asians | 1.4 /100 | #242 | Tragic 97.1% |
Demographics Similar to Lithuanians by 4th Grade
In terms of 4th grade, the demographic groups most similar to Lithuanians are Finnish (98.3%, a difference of 0.0%), Irish (98.4%, a difference of 0.010%), Alaska Native (98.4%, a difference of 0.010%), Polish (98.4%, a difference of 0.020%), and Sioux (98.3%, a difference of 0.020%).
| Demographics | Rating | Rank | 4th Grade |
| Carpatho Rusyns | 100.0 /100 | #14 | Exceptional 98.4% |
| Dutch | 100.0 /100 | #15 | Exceptional 98.4% |
| Scottish | 100.0 /100 | #16 | Exceptional 98.4% |
| Pennsylvania Germans | 100.0 /100 | #17 | Exceptional 98.4% |
| Poles | 100.0 /100 | #18 | Exceptional 98.4% |
| Irish | 100.0 /100 | #19 | Exceptional 98.4% |
| Alaska Natives | 100.0 /100 | #20 | Exceptional 98.4% |
| Lithuanians | 100.0 /100 | #21 | Exceptional 98.3% |
| Finns | 100.0 /100 | #22 | Exceptional 98.3% |
| Sioux | 100.0 /100 | #23 | Exceptional 98.3% |
| Danes | 100.0 /100 | #24 | Exceptional 98.3% |
| Scotch-Irish | 100.0 /100 | #25 | Exceptional 98.3% |
| Croatians | 100.0 /100 | #26 | Exceptional 98.3% |
| French Canadians | 100.0 /100 | #27 | Exceptional 98.3% |
| French | 100.0 /100 | #28 | Exceptional 98.3% |