Yuman vs Immigrants from Chile Single Mother Poverty
COMPARE
Yuman
Immigrants from Chile
Single Mother Poverty
Single Mother Poverty Comparison
Yuman
Immigrants from Chile
37.8%
SINGLE MOTHER POVERTY
0.0/ 100
METRIC RATING
335th/ 347
METRIC RANK
28.4%
SINGLE MOTHER POVERTY
90.8/ 100
METRIC RATING
126th/ 347
METRIC RANK
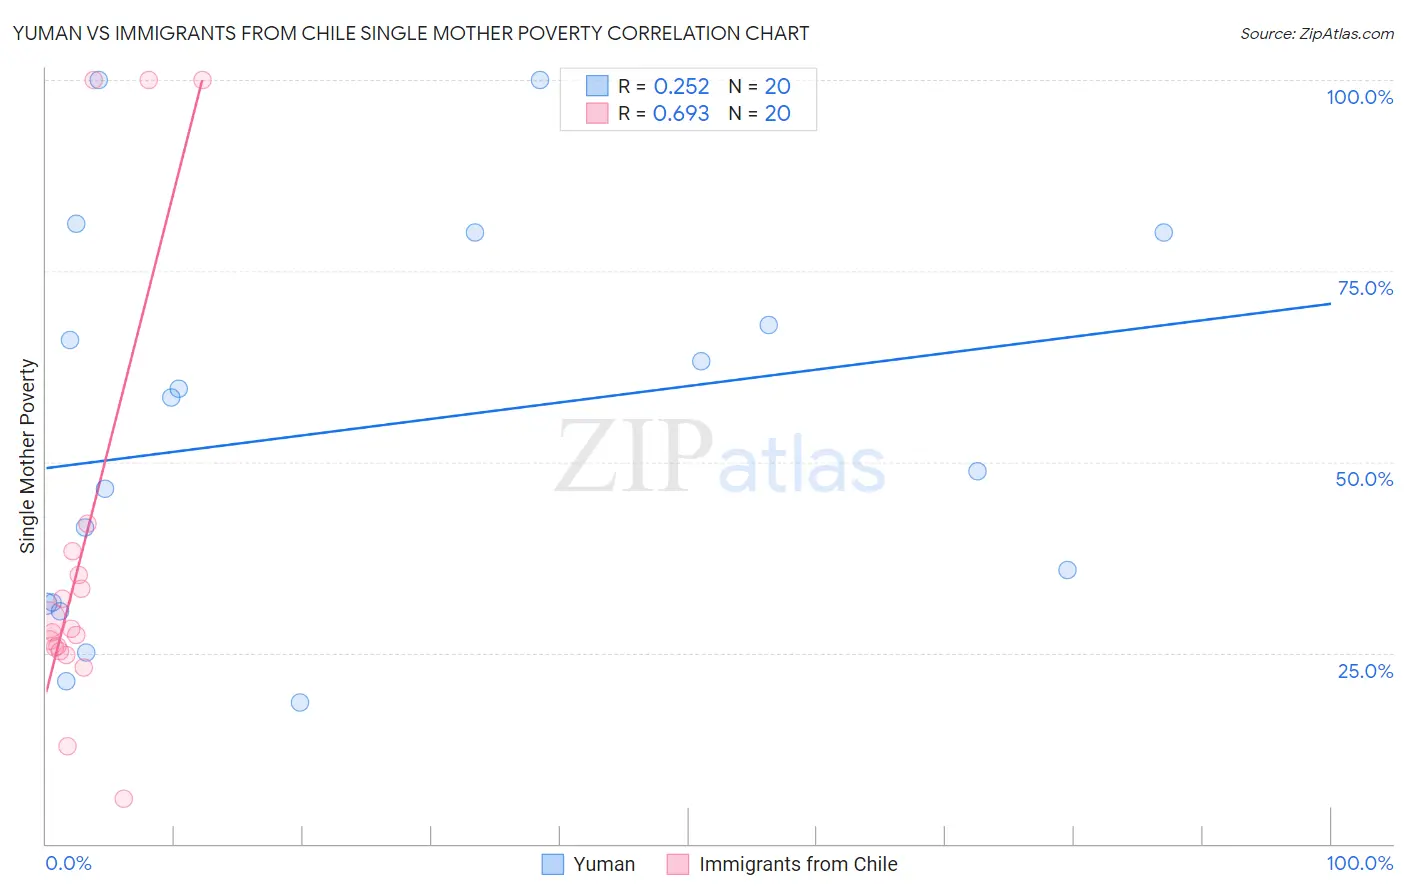
Yuman vs Immigrants from Chile Single Mother Poverty Correlation Chart
The statistical analysis conducted on geographies consisting of 40,528,655 people shows a weak positive correlation between the proportion of Yuman and poverty level among single mothers in the United States with a correlation coefficient (R) of 0.252 and weighted average of 37.8%. Similarly, the statistical analysis conducted on geographies consisting of 215,689,782 people shows a significant positive correlation between the proportion of Immigrants from Chile and poverty level among single mothers in the United States with a correlation coefficient (R) of 0.693 and weighted average of 28.4%, a difference of 33.1%.
Single Mother Poverty Correlation Summary
| Measurement | Yuman | Immigrants from Chile |
| Minimum | 18.5% | 5.9% |
| Maximum | 100.0% | 100.0% |
| Range | 81.5% | 94.1% |
| Mean | 54.4% | 38.1% |
| Median | 53.5% | 27.9% |
| Interquartile 25% (IQ1) | 31.5% | 25.4% |
| Interquartile 75% (IQ3) | 74.0% | 36.7% |
| Interquartile Range (IQR) | 42.5% | 11.3% |
| Standard Deviation (Sample) | 25.2% | 27.8% |
| Standard Deviation (Population) | 24.6% | 27.1% |
Similar Demographics by Single Mother Poverty
Demographics Similar to Yuman by Single Mother Poverty
In terms of single mother poverty, the demographic groups most similar to Yuman are Pueblo (37.2%, a difference of 1.5%), Menominee (37.1%, a difference of 1.9%), Cheyenne (38.5%, a difference of 1.9%), Immigrants from Yemen (38.5%, a difference of 2.0%), and Pima (38.6%, a difference of 2.2%).
| Demographics | Rating | Rank | Single Mother Poverty |
| Choctaw | 0.0 /100 | #328 | Tragic 36.4% |
| Apache | 0.0 /100 | #329 | Tragic 36.6% |
| Natives/Alaskans | 0.0 /100 | #330 | Tragic 36.6% |
| Creek | 0.0 /100 | #331 | Tragic 36.7% |
| Dutch West Indians | 0.0 /100 | #332 | Tragic 36.8% |
| Menominee | 0.0 /100 | #333 | Tragic 37.1% |
| Pueblo | 0.0 /100 | #334 | Tragic 37.2% |
| Yuman | 0.0 /100 | #335 | Tragic 37.8% |
| Cheyenne | 0.0 /100 | #336 | Tragic 38.5% |
| Immigrants | Yemen | 0.0 /100 | #337 | Tragic 38.5% |
| Pima | 0.0 /100 | #338 | Tragic 38.6% |
| Crow | 0.0 /100 | #339 | Tragic 38.6% |
| Sioux | 0.0 /100 | #340 | Tragic 38.8% |
| Colville | 0.0 /100 | #341 | Tragic 39.3% |
| Navajo | 0.0 /100 | #342 | Tragic 40.2% |
Demographics Similar to Immigrants from Chile by Single Mother Poverty
In terms of single mother poverty, the demographic groups most similar to Immigrants from Chile are Kenyan (28.4%, a difference of 0.010%), Polish (28.4%, a difference of 0.010%), Immigrants from England (28.4%, a difference of 0.040%), South American (28.4%, a difference of 0.070%), and Norwegian (28.4%, a difference of 0.070%).
| Demographics | Rating | Rank | Single Mother Poverty |
| Immigrants | Syria | 92.4 /100 | #119 | Exceptional 28.3% |
| Cypriots | 92.3 /100 | #120 | Exceptional 28.3% |
| Immigrants | Afghanistan | 92.1 /100 | #121 | Exceptional 28.3% |
| Colombians | 91.8 /100 | #122 | Exceptional 28.3% |
| Uruguayans | 91.7 /100 | #123 | Exceptional 28.3% |
| Immigrants | Switzerland | 91.7 /100 | #124 | Exceptional 28.3% |
| Kenyans | 90.9 /100 | #125 | Exceptional 28.4% |
| Immigrants | Chile | 90.8 /100 | #126 | Exceptional 28.4% |
| Poles | 90.8 /100 | #127 | Exceptional 28.4% |
| Immigrants | England | 90.5 /100 | #128 | Exceptional 28.4% |
| South Americans | 90.4 /100 | #129 | Exceptional 28.4% |
| Norwegians | 90.4 /100 | #130 | Exceptional 28.4% |
| Immigrants | Austria | 90.3 /100 | #131 | Exceptional 28.4% |
| Immigrants | Morocco | 89.5 /100 | #132 | Excellent 28.4% |
| Swedes | 89.4 /100 | #133 | Excellent 28.4% |