Immigrants from Ethiopia vs Lithuanian Single Mother Poverty
COMPARE
Immigrants from Ethiopia
Lithuanian
Single Mother Poverty
Single Mother Poverty Comparison
Immigrants from Ethiopia
Lithuanians
27.7%
SINGLE MOTHER POVERTY
98.4/ 100
METRIC RATING
89th/ 347
METRIC RANK
27.4%
SINGLE MOTHER POVERTY
99.4/ 100
METRIC RATING
69th/ 347
METRIC RANK
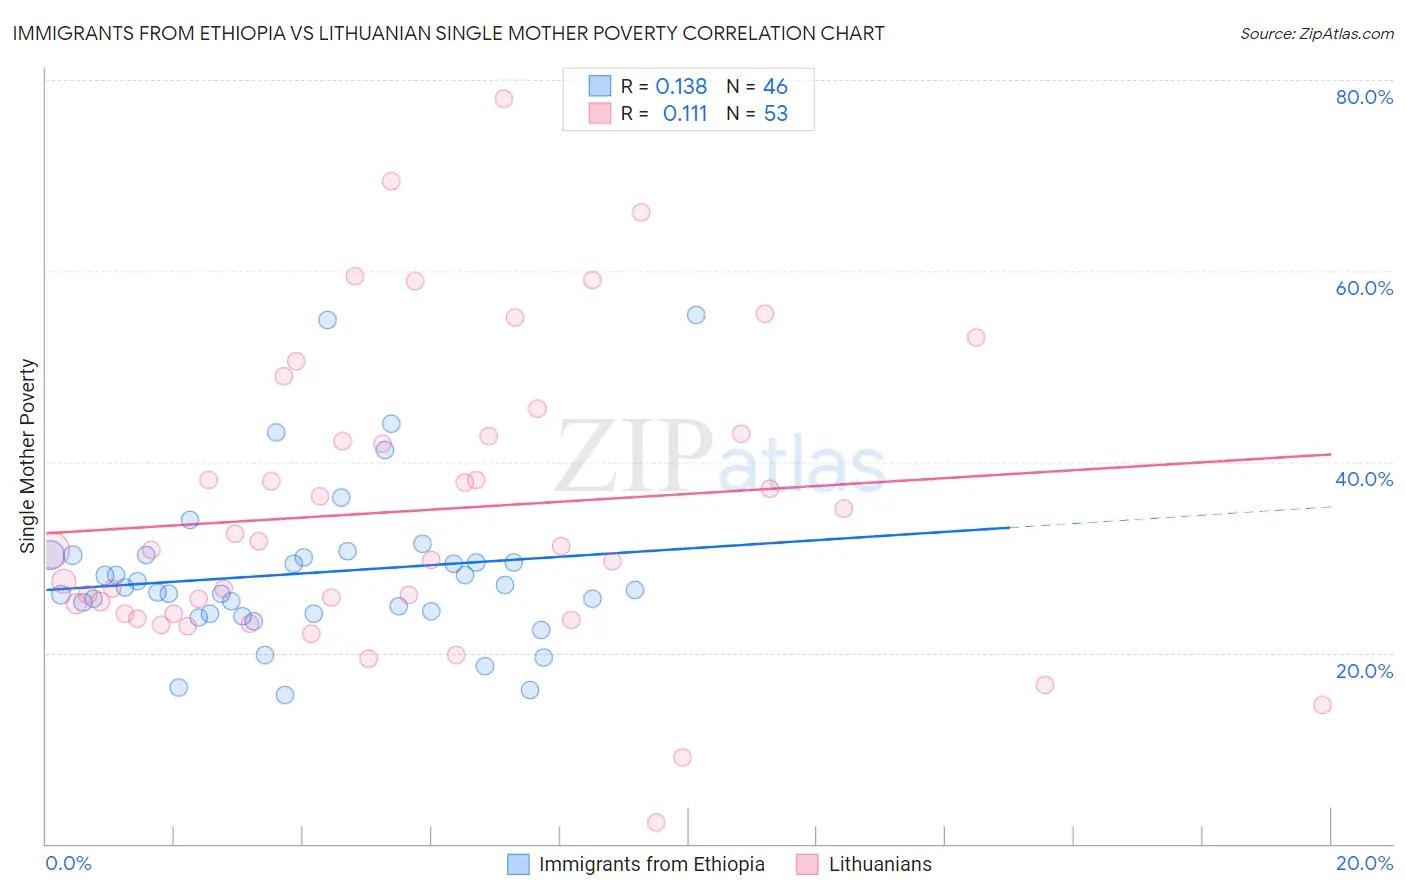
Immigrants from Ethiopia vs Lithuanian Single Mother Poverty Correlation Chart
The statistical analysis conducted on geographies consisting of 209,365,382 people shows a poor positive correlation between the proportion of Immigrants from Ethiopia and poverty level among single mothers in the United States with a correlation coefficient (R) of 0.138 and weighted average of 27.7%. Similarly, the statistical analysis conducted on geographies consisting of 407,174,767 people shows a poor positive correlation between the proportion of Lithuanians and poverty level among single mothers in the United States with a correlation coefficient (R) of 0.111 and weighted average of 27.4%, a difference of 1.2%.
Single Mother Poverty Correlation Summary
| Measurement | Immigrants from Ethiopia | Lithuanian |
| Minimum | 15.6% | 2.2% |
| Maximum | 55.4% | 78.1% |
| Range | 39.9% | 75.9% |
| Mean | 28.4% | 34.9% |
| Median | 26.7% | 30.8% |
| Interquartile 25% (IQ1) | 24.1% | 24.1% |
| Interquartile 75% (IQ3) | 30.2% | 42.8% |
| Interquartile Range (IQR) | 6.1% | 18.7% |
| Standard Deviation (Sample) | 8.3% | 15.6% |
| Standard Deviation (Population) | 8.2% | 15.5% |
Demographics Similar to Immigrants from Ethiopia and Lithuanians by Single Mother Poverty
In terms of single mother poverty, the demographic groups most similar to Immigrants from Ethiopia are Ethiopian (27.7%, a difference of 0.020%), Afghan (27.7%, a difference of 0.040%), Immigrants from Ukraine (27.7%, a difference of 0.14%), Immigrants from Latvia (27.7%, a difference of 0.23%), and Mongolian (27.7%, a difference of 0.23%). Similarly, the demographic groups most similar to Lithuanians are Immigrants from Belarus (27.4%, a difference of 0.010%), Macedonian (27.4%, a difference of 0.030%), Immigrants from Russia (27.4%, a difference of 0.060%), Sierra Leonean (27.4%, a difference of 0.12%), and Immigrants from Europe (27.4%, a difference of 0.18%).
| Demographics | Rating | Rank | Single Mother Poverty |
| Lithuanians | 99.4 /100 | #69 | Exceptional 27.4% |
| Immigrants | Belarus | 99.4 /100 | #70 | Exceptional 27.4% |
| Macedonians | 99.4 /100 | #71 | Exceptional 27.4% |
| Immigrants | Russia | 99.4 /100 | #72 | Exceptional 27.4% |
| Sierra Leoneans | 99.3 /100 | #73 | Exceptional 27.4% |
| Immigrants | Europe | 99.3 /100 | #74 | Exceptional 27.4% |
| Immigrants | Sweden | 99.2 /100 | #75 | Exceptional 27.5% |
| Peruvians | 99.2 /100 | #76 | Exceptional 27.5% |
| Immigrants | Peru | 99.2 /100 | #77 | Exceptional 27.5% |
| Immigrants | North Macedonia | 99.2 /100 | #78 | Exceptional 27.5% |
| Immigrants | Italy | 99.1 /100 | #79 | Exceptional 27.5% |
| Taiwanese | 99.1 /100 | #80 | Exceptional 27.5% |
| Immigrants | Scotland | 98.9 /100 | #81 | Exceptional 27.6% |
| Immigrants | Cameroon | 98.8 /100 | #82 | Exceptional 27.6% |
| Greeks | 98.7 /100 | #83 | Exceptional 27.7% |
| Immigrants | Latvia | 98.7 /100 | #84 | Exceptional 27.7% |
| Mongolians | 98.7 /100 | #85 | Exceptional 27.7% |
| Immigrants | Ukraine | 98.6 /100 | #86 | Exceptional 27.7% |
| Afghans | 98.5 /100 | #87 | Exceptional 27.7% |
| Ethiopians | 98.4 /100 | #88 | Exceptional 27.7% |
| Immigrants | Ethiopia | 98.4 /100 | #89 | Exceptional 27.7% |