Yuman vs Croatian Average Family Size
COMPARE
Yuman
Croatian
Average Family Size
Average Family Size Comparison
Yuman
Croatians
3.47
AVERAGE FAMILY SIZE
100.0/ 100
METRIC RATING
21st/ 347
METRIC RANK
3.10
AVERAGE FAMILY SIZE
0.0/ 100
METRIC RATING
339th/ 347
METRIC RANK
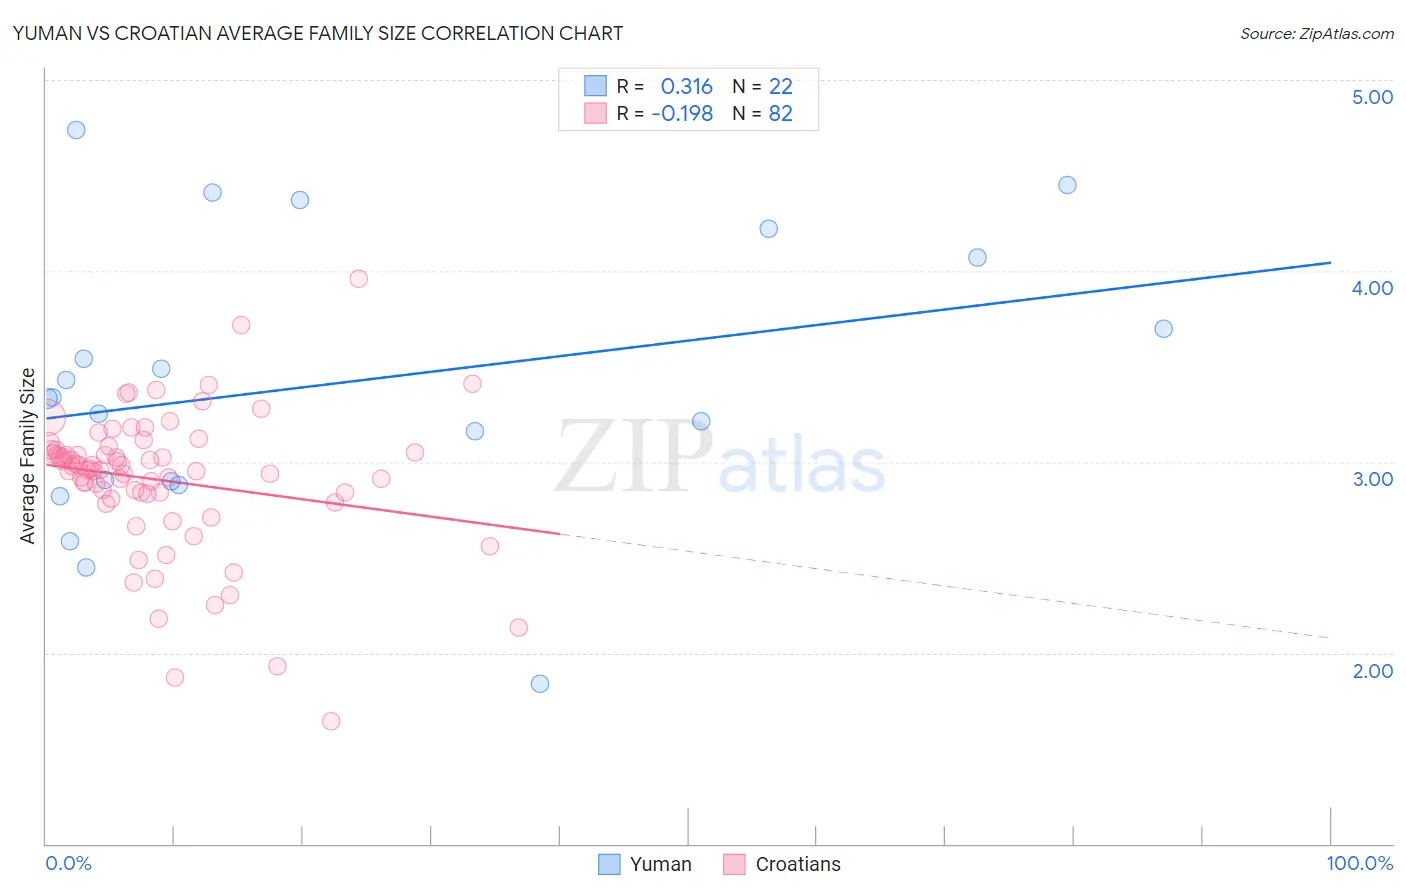
Yuman vs Croatian Average Family Size Correlation Chart
The statistical analysis conducted on geographies consisting of 40,663,604 people shows a mild positive correlation between the proportion of Yuman and average family size in the United States with a correlation coefficient (R) of 0.316 and weighted average of 3.47. Similarly, the statistical analysis conducted on geographies consisting of 375,543,133 people shows a poor negative correlation between the proportion of Croatians and average family size in the United States with a correlation coefficient (R) of -0.198 and weighted average of 3.10, a difference of 11.8%.
Average Family Size Correlation Summary
| Measurement | Yuman | Croatian |
| Minimum | 1.84 | 1.64 |
| Maximum | 4.74 | 3.96 |
| Range | 2.90 | 2.32 |
| Mean | 3.41 | 2.90 |
| Median | 3.33 | 2.96 |
| Interquartile 25% (IQ1) | 2.90 | 2.83 |
| Interquartile 75% (IQ3) | 4.07 | 3.06 |
| Interquartile Range (IQR) | 1.17 | 0.23 |
| Standard Deviation (Sample) | 0.73 | 0.37 |
| Standard Deviation (Population) | 0.72 | 0.37 |
Similar Demographics by Average Family Size
Demographics Similar to Yuman by Average Family Size
In terms of average family size, the demographic groups most similar to Yuman are Apache (3.46, a difference of 0.060%), Cheyenne (3.47, a difference of 0.25%), Mexican (3.48, a difference of 0.30%), Immigrants from Fiji (3.45, a difference of 0.35%), and Salvadoran (3.48, a difference of 0.36%).
| Demographics | Rating | Rank | Average Family Size |
| Immigrants | Central America | 100.0 /100 | #14 | Exceptional 3.49 |
| Tongans | 100.0 /100 | #15 | Exceptional 3.49 |
| Ute | 100.0 /100 | #16 | Exceptional 3.49 |
| Immigrants | El Salvador | 100.0 /100 | #17 | Exceptional 3.49 |
| Salvadorans | 100.0 /100 | #18 | Exceptional 3.48 |
| Mexicans | 100.0 /100 | #19 | Exceptional 3.48 |
| Cheyenne | 100.0 /100 | #20 | Exceptional 3.47 |
| Yuman | 100.0 /100 | #21 | Exceptional 3.47 |
| Apache | 100.0 /100 | #22 | Exceptional 3.46 |
| Immigrants | Fiji | 100.0 /100 | #23 | Exceptional 3.45 |
| Natives/Alaskans | 100.0 /100 | #24 | Exceptional 3.45 |
| Yakama | 100.0 /100 | #25 | Exceptional 3.45 |
| Native Hawaiians | 100.0 /100 | #26 | Exceptional 3.43 |
| Mexican American Indians | 100.0 /100 | #27 | Exceptional 3.43 |
| Immigrants | Latin America | 100.0 /100 | #28 | Exceptional 3.42 |
Demographics Similar to Croatians by Average Family Size
In terms of average family size, the demographic groups most similar to Croatians are French (3.10, a difference of 0.010%), Swedish (3.10, a difference of 0.030%), Irish (3.10, a difference of 0.070%), Luxembourger (3.10, a difference of 0.13%), and Finnish (3.09, a difference of 0.14%).
| Demographics | Rating | Rank | Average Family Size |
| Scottish | 0.0 /100 | #332 | Tragic 3.11 |
| Estonians | 0.0 /100 | #333 | Tragic 3.10 |
| Lithuanians | 0.0 /100 | #334 | Tragic 3.10 |
| Luxembourgers | 0.0 /100 | #335 | Tragic 3.10 |
| Irish | 0.0 /100 | #336 | Tragic 3.10 |
| Swedes | 0.0 /100 | #337 | Tragic 3.10 |
| French | 0.0 /100 | #338 | Tragic 3.10 |
| Croatians | 0.0 /100 | #339 | Tragic 3.10 |
| Finns | 0.0 /100 | #340 | Tragic 3.09 |
| Poles | 0.0 /100 | #341 | Tragic 3.09 |
| Germans | 0.0 /100 | #342 | Tragic 3.09 |
| Norwegians | 0.0 /100 | #343 | Tragic 3.08 |
| French Canadians | 0.0 /100 | #344 | Tragic 3.07 |
| Slovenes | 0.0 /100 | #345 | Tragic 3.07 |
| Slovaks | 0.0 /100 | #346 | Tragic 3.06 |