Yugoslavian vs Central American Indian Poverty
COMPARE
Yugoslavian
Central American Indian
Poverty
Poverty Comparison
Yugoslavians
Central American Indians
11.8%
POVERTY
85.2/ 100
METRIC RATING
134th/ 347
METRIC RANK
16.7%
POVERTY
0.0/ 100
METRIC RATING
325th/ 347
METRIC RANK
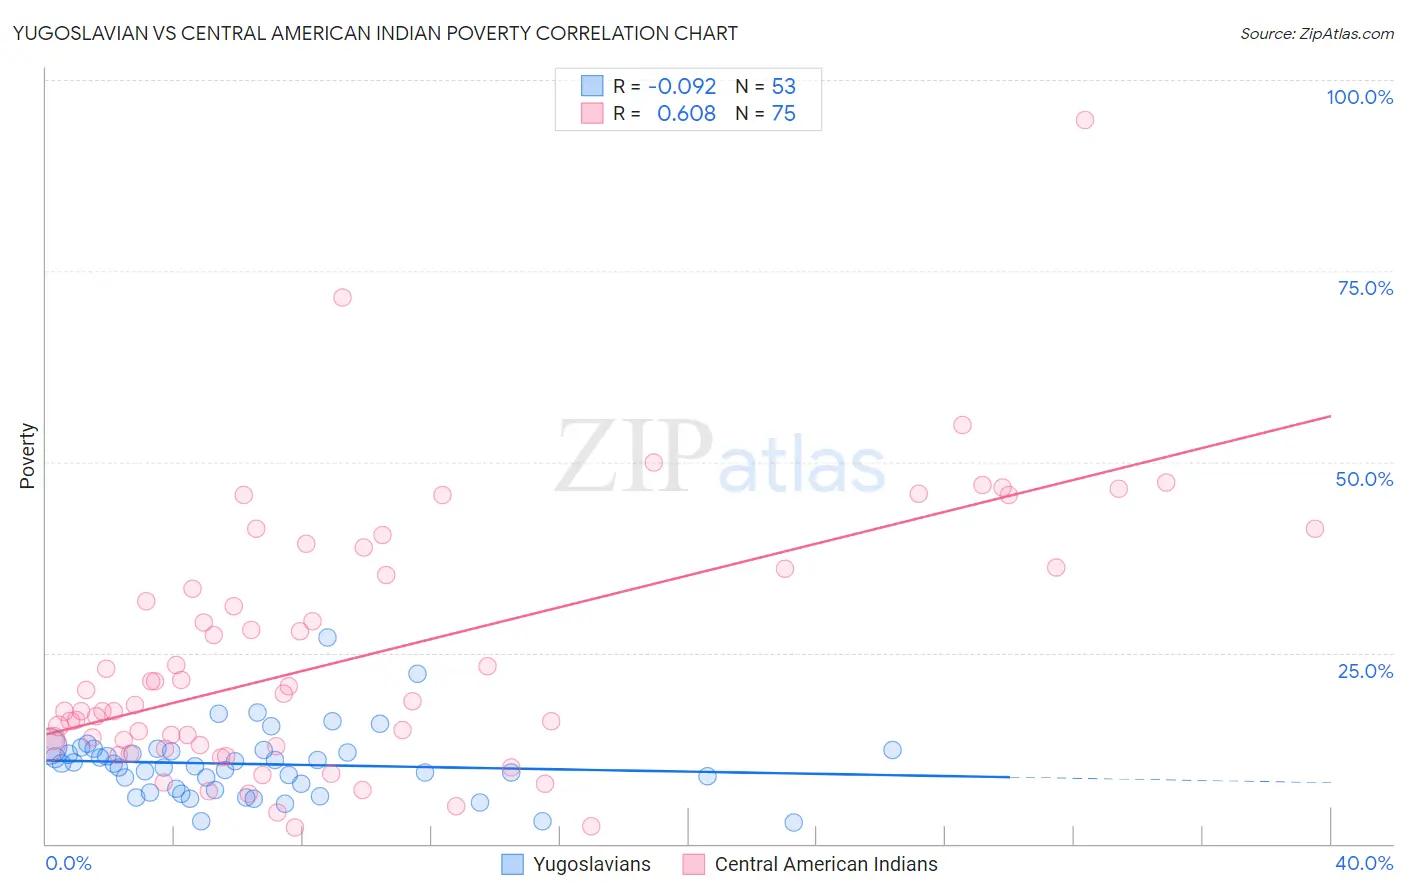
Yugoslavian vs Central American Indian Poverty Correlation Chart
The statistical analysis conducted on geographies consisting of 285,571,582 people shows a slight negative correlation between the proportion of Yugoslavians and poverty level in the United States with a correlation coefficient (R) of -0.092 and weighted average of 11.8%. Similarly, the statistical analysis conducted on geographies consisting of 326,078,193 people shows a significant positive correlation between the proportion of Central American Indians and poverty level in the United States with a correlation coefficient (R) of 0.608 and weighted average of 16.7%, a difference of 41.5%.
Poverty Correlation Summary
| Measurement | Yugoslavian | Central American Indian |
| Minimum | 2.7% | 2.1% |
| Maximum | 27.0% | 94.8% |
| Range | 24.3% | 92.7% |
| Mean | 10.4% | 24.6% |
| Median | 10.5% | 18.6% |
| Interquartile 25% (IQ1) | 7.1% | 12.9% |
| Interquartile 75% (IQ3) | 12.3% | 36.0% |
| Interquartile Range (IQR) | 5.2% | 23.1% |
| Standard Deviation (Sample) | 4.4% | 16.9% |
| Standard Deviation (Population) | 4.4% | 16.8% |
Similar Demographics by Poverty
Demographics Similar to Yugoslavians by Poverty
In terms of poverty, the demographic groups most similar to Yugoslavians are Immigrants from Western Europe (11.8%, a difference of 0.010%), Immigrants from Vietnam (11.8%, a difference of 0.010%), Peruvian (11.8%, a difference of 0.080%), French (11.8%, a difference of 0.19%), and Chilean (11.8%, a difference of 0.20%).
| Demographics | Rating | Rank | Poverty |
| Immigrants | Argentina | 88.0 /100 | #127 | Excellent 11.7% |
| Immigrants | Israel | 87.4 /100 | #128 | Excellent 11.7% |
| South Africans | 87.0 /100 | #129 | Excellent 11.7% |
| Immigrants | Ukraine | 86.6 /100 | #130 | Excellent 11.8% |
| French | 86.1 /100 | #131 | Excellent 11.8% |
| Peruvians | 85.6 /100 | #132 | Excellent 11.8% |
| Immigrants | Western Europe | 85.2 /100 | #133 | Excellent 11.8% |
| Yugoslavians | 85.2 /100 | #134 | Excellent 11.8% |
| Immigrants | Vietnam | 85.2 /100 | #135 | Excellent 11.8% |
| Chileans | 84.2 /100 | #136 | Excellent 11.8% |
| Immigrants | Switzerland | 83.0 /100 | #137 | Excellent 11.8% |
| Immigrants | Jordan | 82.4 /100 | #138 | Excellent 11.9% |
| Pakistanis | 82.2 /100 | #139 | Excellent 11.9% |
| Immigrants | Peru | 81.1 /100 | #140 | Excellent 11.9% |
| Immigrants | France | 80.5 /100 | #141 | Excellent 11.9% |
Demographics Similar to Central American Indians by Poverty
In terms of poverty, the demographic groups most similar to Central American Indians are Yakama (16.7%, a difference of 0.23%), Paiute (16.7%, a difference of 0.29%), Colville (16.6%, a difference of 0.77%), Kiowa (16.8%, a difference of 0.82%), and Ute (16.9%, a difference of 1.3%).
| Demographics | Rating | Rank | Poverty |
| Immigrants | Dominica | 0.0 /100 | #318 | Tragic 16.1% |
| Immigrants | Congo | 0.0 /100 | #319 | Tragic 16.1% |
| Immigrants | Honduras | 0.0 /100 | #320 | Tragic 16.2% |
| Arapaho | 0.0 /100 | #321 | Tragic 16.3% |
| Menominee | 0.0 /100 | #322 | Tragic 16.4% |
| Colville | 0.0 /100 | #323 | Tragic 16.6% |
| Yakama | 0.0 /100 | #324 | Tragic 16.7% |
| Central American Indians | 0.0 /100 | #325 | Tragic 16.7% |
| Paiute | 0.0 /100 | #326 | Tragic 16.7% |
| Kiowa | 0.0 /100 | #327 | Tragic 16.8% |
| Ute | 0.0 /100 | #328 | Tragic 16.9% |
| Blacks/African Americans | 0.0 /100 | #329 | Tragic 17.3% |
| Dominicans | 0.0 /100 | #330 | Tragic 17.6% |
| Immigrants | Dominican Republic | 0.0 /100 | #331 | Tragic 17.8% |
| Natives/Alaskans | 0.0 /100 | #332 | Tragic 18.1% |