Yugoslavian vs Immigrants from China Poverty
COMPARE
Yugoslavian
Immigrants from China
Poverty
Poverty Comparison
Yugoslavians
Immigrants from China
11.8%
POVERTY
85.2/ 100
METRIC RATING
134th/ 347
METRIC RANK
11.6%
POVERTY
90.7/ 100
METRIC RATING
114th/ 347
METRIC RANK
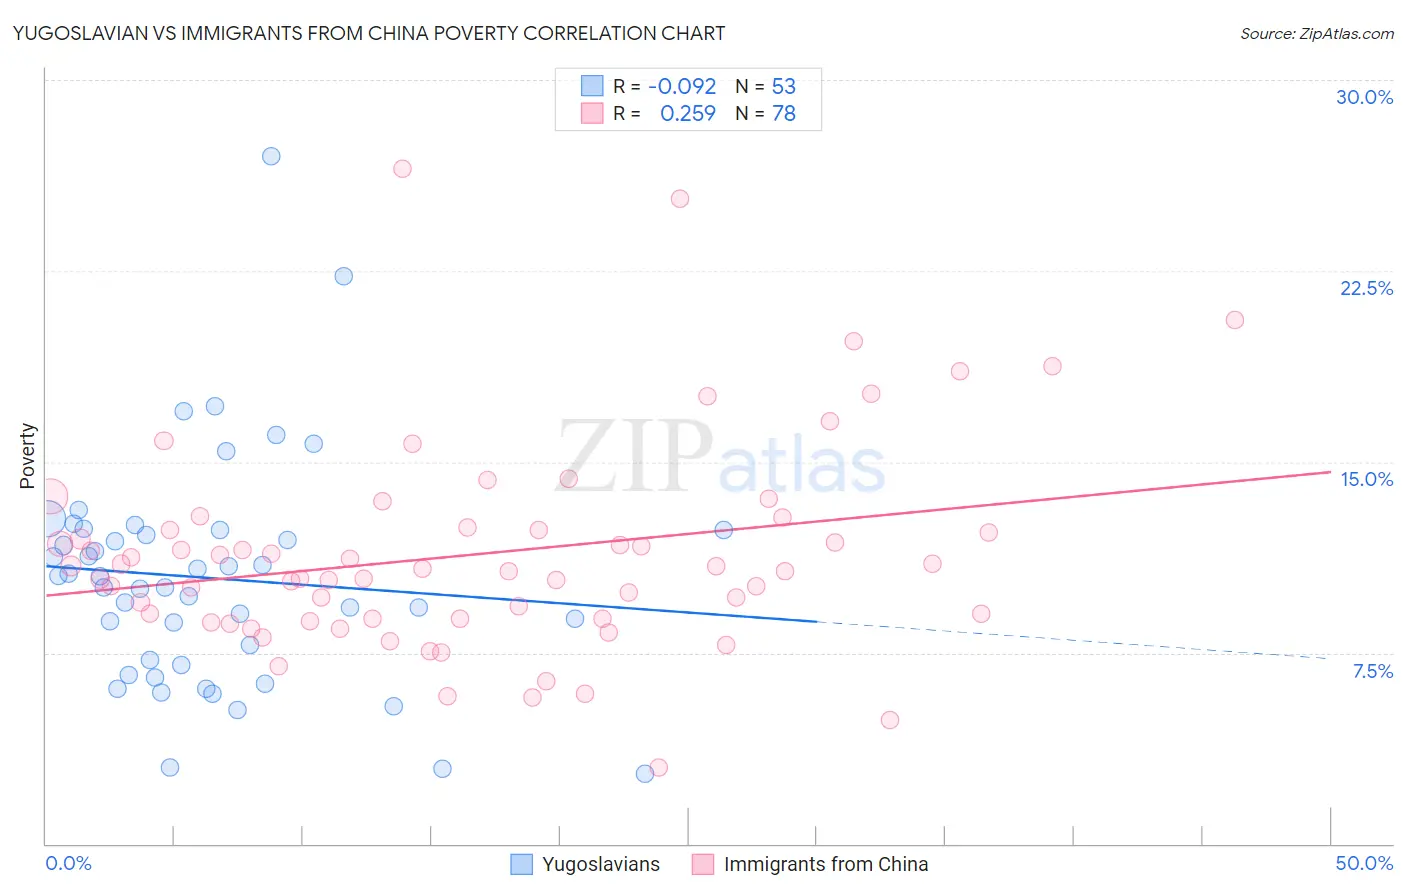
Yugoslavian vs Immigrants from China Poverty Correlation Chart
The statistical analysis conducted on geographies consisting of 285,571,582 people shows a slight negative correlation between the proportion of Yugoslavians and poverty level in the United States with a correlation coefficient (R) of -0.092 and weighted average of 11.8%. Similarly, the statistical analysis conducted on geographies consisting of 456,587,979 people shows a weak positive correlation between the proportion of Immigrants from China and poverty level in the United States with a correlation coefficient (R) of 0.259 and weighted average of 11.6%, a difference of 1.4%.
Poverty Correlation Summary
| Measurement | Yugoslavian | Immigrants from China |
| Minimum | 2.7% | 3.0% |
| Maximum | 27.0% | 26.5% |
| Range | 24.3% | 23.5% |
| Mean | 10.4% | 11.4% |
| Median | 10.5% | 10.8% |
| Interquartile 25% (IQ1) | 7.1% | 8.8% |
| Interquartile 75% (IQ3) | 12.3% | 12.3% |
| Interquartile Range (IQR) | 5.2% | 3.5% |
| Standard Deviation (Sample) | 4.4% | 4.1% |
| Standard Deviation (Population) | 4.4% | 4.1% |
Demographics Similar to Yugoslavians and Immigrants from China by Poverty
In terms of poverty, the demographic groups most similar to Yugoslavians are Immigrants from Western Europe (11.8%, a difference of 0.010%), Peruvian (11.8%, a difference of 0.080%), French (11.8%, a difference of 0.19%), Immigrants from Ukraine (11.8%, a difference of 0.29%), and South African (11.7%, a difference of 0.39%). Similarly, the demographic groups most similar to Immigrants from China are Albanian (11.7%, a difference of 0.14%), Immigrants from Russia (11.7%, a difference of 0.31%), Sri Lankan (11.7%, a difference of 0.38%), Argentinean (11.7%, a difference of 0.46%), and Tlingit-Haida (11.7%, a difference of 0.50%).
| Demographics | Rating | Rank | Poverty |
| Immigrants | China | 90.7 /100 | #114 | Exceptional 11.6% |
| Albanians | 90.3 /100 | #115 | Exceptional 11.7% |
| Immigrants | Russia | 89.7 /100 | #116 | Excellent 11.7% |
| Sri Lankans | 89.4 /100 | #117 | Excellent 11.7% |
| Argentineans | 89.1 /100 | #118 | Excellent 11.7% |
| Tlingit-Haida | 89.0 /100 | #119 | Excellent 11.7% |
| Immigrants | South Eastern Asia | 88.9 /100 | #120 | Excellent 11.7% |
| New Zealanders | 88.7 /100 | #121 | Excellent 11.7% |
| Puget Sound Salish | 88.7 /100 | #122 | Excellent 11.7% |
| Immigrants | Hungary | 88.6 /100 | #123 | Excellent 11.7% |
| Soviet Union | 88.4 /100 | #124 | Excellent 11.7% |
| Immigrants | Brazil | 88.2 /100 | #125 | Excellent 11.7% |
| Immigrants | Norway | 88.0 /100 | #126 | Excellent 11.7% |
| Immigrants | Argentina | 88.0 /100 | #127 | Excellent 11.7% |
| Immigrants | Israel | 87.4 /100 | #128 | Excellent 11.7% |
| South Africans | 87.0 /100 | #129 | Excellent 11.7% |
| Immigrants | Ukraine | 86.6 /100 | #130 | Excellent 11.8% |
| French | 86.1 /100 | #131 | Excellent 11.8% |
| Peruvians | 85.6 /100 | #132 | Excellent 11.8% |
| Immigrants | Western Europe | 85.2 /100 | #133 | Excellent 11.8% |
| Yugoslavians | 85.2 /100 | #134 | Excellent 11.8% |