Colville vs Dominican Male Poverty
COMPARE
Colville
Dominican
Male Poverty
Male Poverty Comparison
Colville
Dominicans
15.2%
MALE POVERTY
0.0/ 100
METRIC RATING
323rd/ 347
METRIC RANK
16.1%
MALE POVERTY
0.0/ 100
METRIC RATING
329th/ 347
METRIC RANK
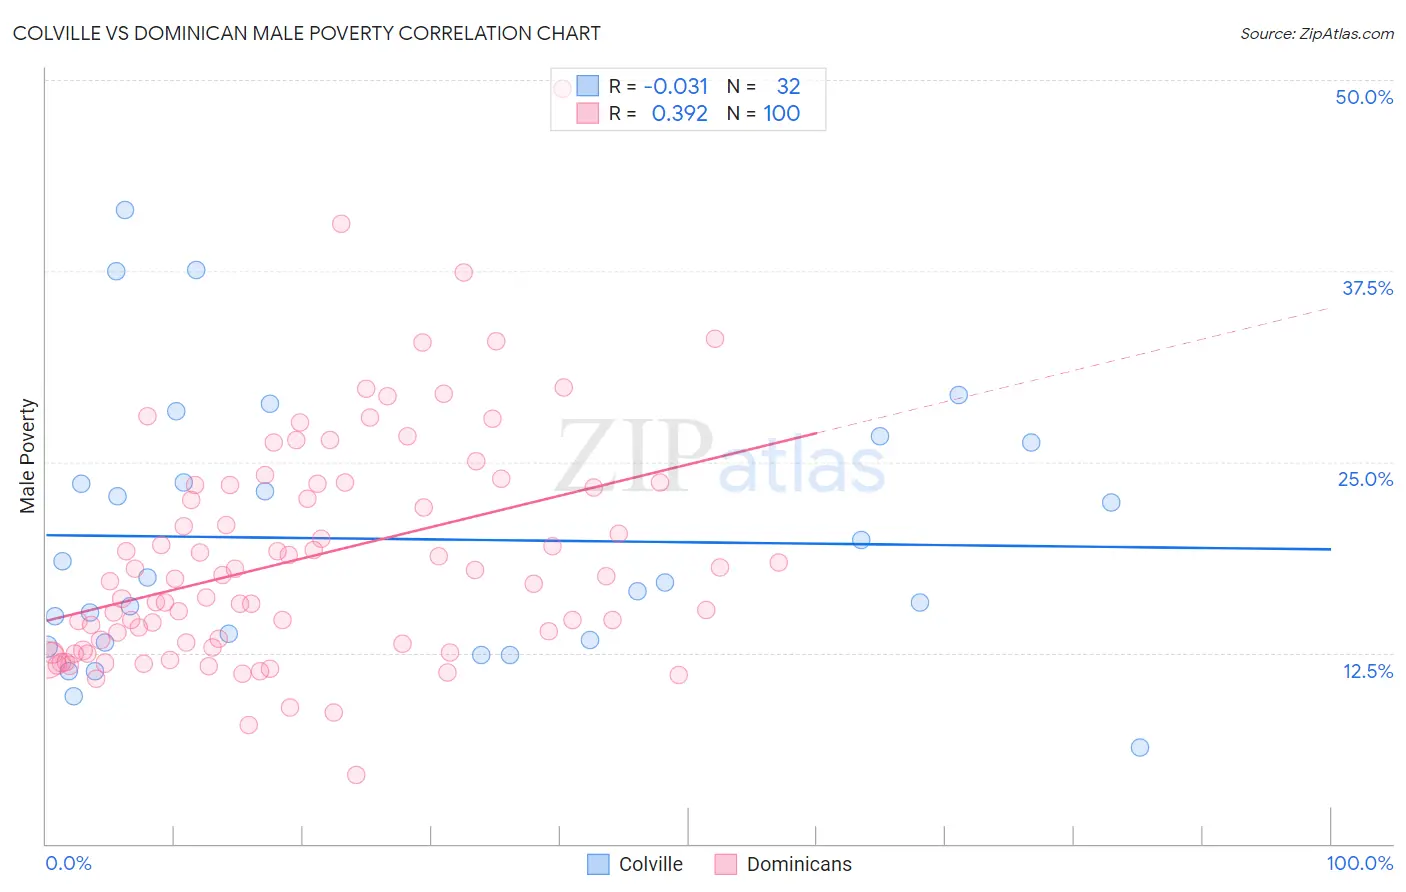
Colville vs Dominican Male Poverty Correlation Chart
The statistical analysis conducted on geographies consisting of 34,680,986 people shows no correlation between the proportion of Colville and poverty level among males in the United States with a correlation coefficient (R) of -0.031 and weighted average of 15.2%. Similarly, the statistical analysis conducted on geographies consisting of 354,651,464 people shows a mild positive correlation between the proportion of Dominicans and poverty level among males in the United States with a correlation coefficient (R) of 0.392 and weighted average of 16.1%, a difference of 5.5%.
Male Poverty Correlation Summary
| Measurement | Colville | Dominican |
| Minimum | 6.3% | 4.5% |
| Maximum | 41.5% | 49.4% |
| Range | 35.2% | 44.9% |
| Mean | 20.0% | 18.7% |
| Median | 17.3% | 17.2% |
| Interquartile 25% (IQ1) | 13.3% | 13.0% |
| Interquartile 75% (IQ3) | 24.9% | 23.5% |
| Interquartile Range (IQR) | 11.7% | 10.5% |
| Standard Deviation (Sample) | 8.6% | 7.5% |
| Standard Deviation (Population) | 8.5% | 7.5% |
Demographics Similar to Colville and Dominicans by Male Poverty
In terms of male poverty, the demographic groups most similar to Colville are Menominee (15.3%, a difference of 0.19%), Yakama (15.3%, a difference of 0.37%), Kiowa (15.2%, a difference of 0.39%), Central American Indian (15.3%, a difference of 0.48%), and Arapaho (15.1%, a difference of 1.1%). Similarly, the demographic groups most similar to Dominicans are Immigrants from Dominican Republic (16.2%, a difference of 0.65%), Ute (16.2%, a difference of 0.99%), Black/African American (15.8%, a difference of 1.7%), Paiute (15.8%, a difference of 1.8%), and Houma (16.7%, a difference of 4.0%).
| Demographics | Rating | Rank | Male Poverty |
| British West Indians | 0.0 /100 | #316 | Tragic 14.6% |
| Immigrants | Dominica | 0.0 /100 | #317 | Tragic 14.7% |
| Immigrants | Grenada | 0.0 /100 | #318 | Tragic 14.7% |
| U.S. Virgin Islanders | 0.0 /100 | #319 | Tragic 14.7% |
| Immigrants | Congo | 0.0 /100 | #320 | Tragic 14.7% |
| Arapaho | 0.0 /100 | #321 | Tragic 15.1% |
| Kiowa | 0.0 /100 | #322 | Tragic 15.2% |
| Colville | 0.0 /100 | #323 | Tragic 15.2% |
| Menominee | 0.0 /100 | #324 | Tragic 15.3% |
| Yakama | 0.0 /100 | #325 | Tragic 15.3% |
| Central American Indians | 0.0 /100 | #326 | Tragic 15.3% |
| Paiute | 0.0 /100 | #327 | Tragic 15.8% |
| Blacks/African Americans | 0.0 /100 | #328 | Tragic 15.8% |
| Dominicans | 0.0 /100 | #329 | Tragic 16.1% |
| Immigrants | Dominican Republic | 0.0 /100 | #330 | Tragic 16.2% |
| Ute | 0.0 /100 | #331 | Tragic 16.2% |
| Houma | 0.0 /100 | #332 | Tragic 16.7% |
| Natives/Alaskans | 0.0 /100 | #333 | Tragic 16.9% |
| Cheyenne | 0.0 /100 | #334 | Tragic 17.6% |
| Apache | 0.0 /100 | #335 | Tragic 17.7% |
| Pueblo | 0.0 /100 | #336 | Tragic 18.5% |