Yaqui vs Dominican Average Family Size
COMPARE
Yaqui
Dominican
Average Family Size
Average Family Size Comparison
Yaqui
Dominicans
3.32
AVERAGE FAMILY SIZE
99.9/ 100
METRIC RATING
73rd/ 347
METRIC RANK
3.34
AVERAGE FAMILY SIZE
99.9/ 100
METRIC RATING
64th/ 347
METRIC RANK
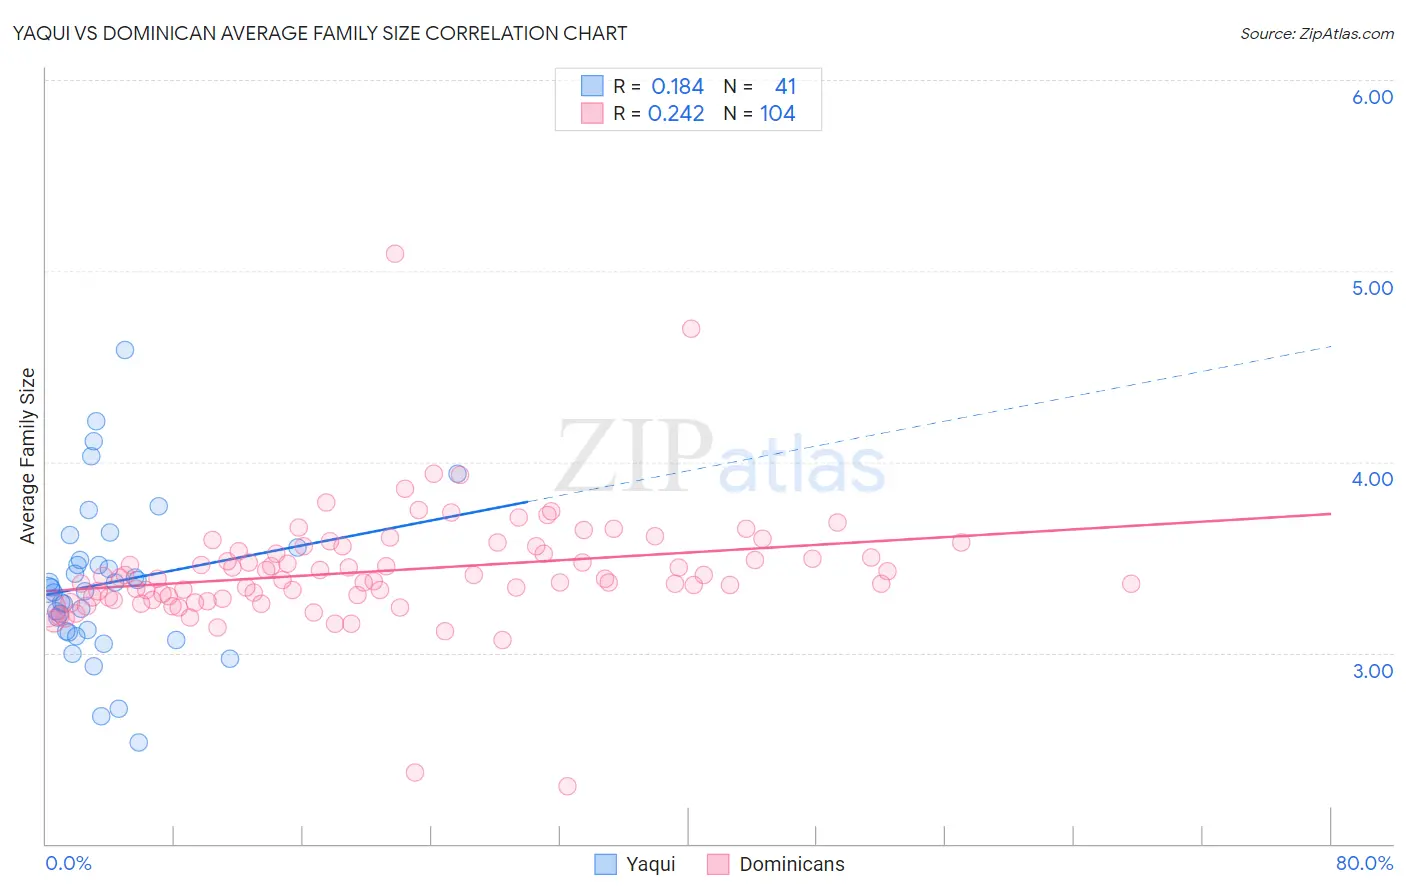
Yaqui vs Dominican Average Family Size Correlation Chart
The statistical analysis conducted on geographies consisting of 107,720,236 people shows a poor positive correlation between the proportion of Yaqui and average family size in the United States with a correlation coefficient (R) of 0.184 and weighted average of 3.32. Similarly, the statistical analysis conducted on geographies consisting of 354,765,302 people shows a weak positive correlation between the proportion of Dominicans and average family size in the United States with a correlation coefficient (R) of 0.242 and weighted average of 3.34, a difference of 0.40%.
Average Family Size Correlation Summary
| Measurement | Yaqui | Dominican |
| Minimum | 2.53 | 2.30 |
| Maximum | 4.58 | 5.09 |
| Range | 2.05 | 2.79 |
| Mean | 3.37 | 3.43 |
| Median | 3.33 | 3.39 |
| Interquartile 25% (IQ1) | 3.11 | 3.29 |
| Interquartile 75% (IQ3) | 3.52 | 3.54 |
| Interquartile Range (IQR) | 0.41 | 0.26 |
| Standard Deviation (Sample) | 0.41 | 0.31 |
| Standard Deviation (Population) | 0.40 | 0.31 |
Demographics Similar to Yaqui and Dominicans by Average Family Size
In terms of average family size, the demographic groups most similar to Yaqui are Immigrants from Caribbean (3.33, a difference of 0.030%), Immigrants from Sierra Leone (3.32, a difference of 0.030%), Immigrants from Barbados (3.32, a difference of 0.060%), Trinidadian and Tobagonian (3.32, a difference of 0.080%), and Immigrants from Ecuador (3.32, a difference of 0.090%). Similarly, the demographic groups most similar to Dominicans are Immigrants from Laos (3.34, a difference of 0.020%), Chinese (3.34, a difference of 0.070%), Immigrants from St. Vincent and the Grenadines (3.34, a difference of 0.080%), Immigrants from Grenada (3.34, a difference of 0.090%), and Immigrants from Jamaica (3.33, a difference of 0.12%).
| Demographics | Rating | Rank | Average Family Size |
| Hondurans | 100.0 /100 | #58 | Exceptional 3.35 |
| Japanese | 100.0 /100 | #59 | Exceptional 3.35 |
| Immigrants | Armenia | 100.0 /100 | #60 | Exceptional 3.35 |
| Central American Indians | 100.0 /100 | #61 | Exceptional 3.35 |
| Immigrants | Grenada | 100.0 /100 | #62 | Exceptional 3.34 |
| Chinese | 100.0 /100 | #63 | Exceptional 3.34 |
| Dominicans | 99.9 /100 | #64 | Exceptional 3.34 |
| Immigrants | Laos | 99.9 /100 | #65 | Exceptional 3.34 |
| Immigrants | St. Vincent and the Grenadines | 99.9 /100 | #66 | Exceptional 3.34 |
| Immigrants | Jamaica | 99.9 /100 | #67 | Exceptional 3.33 |
| Immigrants | Cambodia | 99.9 /100 | #68 | Exceptional 3.33 |
| Immigrants | Immigrants | 99.9 /100 | #69 | Exceptional 3.33 |
| Immigrants | Trinidad and Tobago | 99.9 /100 | #70 | Exceptional 3.33 |
| Immigrants | West Indies | 99.9 /100 | #71 | Exceptional 3.33 |
| Immigrants | Caribbean | 99.9 /100 | #72 | Exceptional 3.33 |
| Yaqui | 99.9 /100 | #73 | Exceptional 3.32 |
| Immigrants | Sierra Leone | 99.9 /100 | #74 | Exceptional 3.32 |
| Immigrants | Barbados | 99.8 /100 | #75 | Exceptional 3.32 |
| Trinidadians and Tobagonians | 99.8 /100 | #76 | Exceptional 3.32 |
| Immigrants | Ecuador | 99.8 /100 | #77 | Exceptional 3.32 |
| Immigrants | Micronesia | 99.8 /100 | #78 | Exceptional 3.32 |