Yaqui vs Dominican 9th Grade
COMPARE
Yaqui
Dominican
9th Grade
9th Grade Comparison
Yaqui
Dominicans
92.9%
9TH GRADE
0.0/ 100
METRIC RATING
300th/ 347
METRIC RANK
91.1%
9TH GRADE
0.0/ 100
METRIC RATING
328th/ 347
METRIC RANK
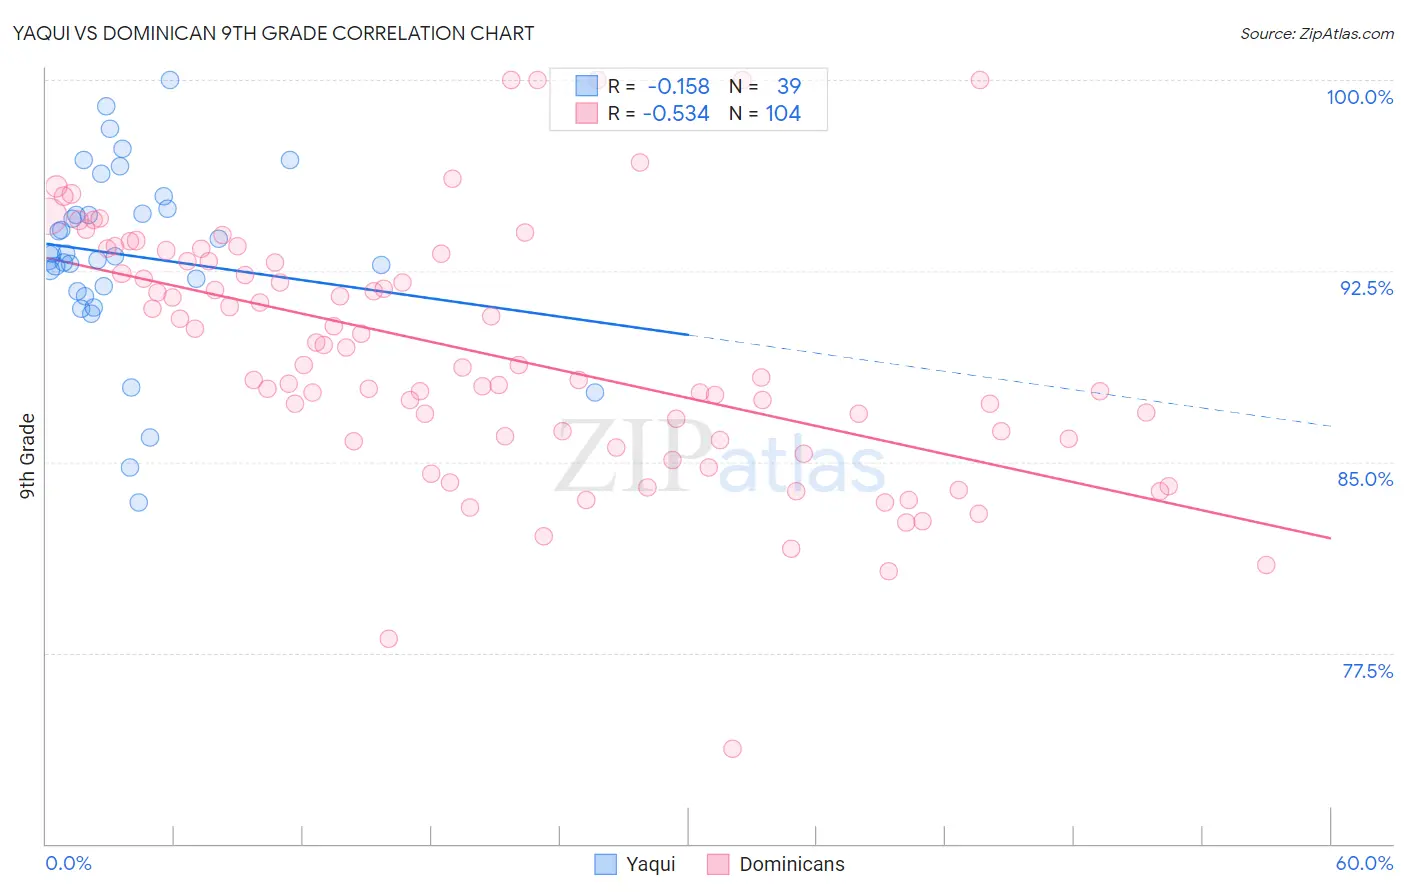
Yaqui vs Dominican 9th Grade Correlation Chart
The statistical analysis conducted on geographies consisting of 107,725,021 people shows a poor negative correlation between the proportion of Yaqui and percentage of population with at least 9th grade education in the United States with a correlation coefficient (R) of -0.158 and weighted average of 92.9%. Similarly, the statistical analysis conducted on geographies consisting of 355,142,452 people shows a substantial negative correlation between the proportion of Dominicans and percentage of population with at least 9th grade education in the United States with a correlation coefficient (R) of -0.534 and weighted average of 91.1%, a difference of 2.0%.
9th Grade Correlation Summary
| Measurement | Yaqui | Dominican |
| Minimum | 83.4% | 73.7% |
| Maximum | 100.0% | 100.0% |
| Range | 16.6% | 26.3% |
| Mean | 93.1% | 89.2% |
| Median | 93.1% | 88.7% |
| Interquartile 25% (IQ1) | 91.7% | 85.9% |
| Interquartile 75% (IQ3) | 94.9% | 92.9% |
| Interquartile Range (IQR) | 3.2% | 7.0% |
| Standard Deviation (Sample) | 3.6% | 4.9% |
| Standard Deviation (Population) | 3.5% | 4.9% |
Similar Demographics by 9th Grade
Demographics Similar to Yaqui by 9th Grade
In terms of 9th grade, the demographic groups most similar to Yaqui are Immigrants from Grenada (93.0%, a difference of 0.13%), Immigrants from Haiti (92.7%, a difference of 0.17%), Haitian (93.1%, a difference of 0.20%), Fijian (93.1%, a difference of 0.22%), and Immigrants from Dominica (92.7%, a difference of 0.25%).
| Demographics | Rating | Rank | 9th Grade |
| Sri Lankans | 0.0 /100 | #293 | Tragic 93.2% |
| Cubans | 0.0 /100 | #294 | Tragic 93.2% |
| Immigrants | Burma/Myanmar | 0.0 /100 | #295 | Tragic 93.1% |
| Indonesians | 0.0 /100 | #296 | Tragic 93.1% |
| Fijians | 0.0 /100 | #297 | Tragic 93.1% |
| Haitians | 0.0 /100 | #298 | Tragic 93.1% |
| Immigrants | Grenada | 0.0 /100 | #299 | Tragic 93.0% |
| Yaqui | 0.0 /100 | #300 | Tragic 92.9% |
| Immigrants | Haiti | 0.0 /100 | #301 | Tragic 92.7% |
| Immigrants | Dominica | 0.0 /100 | #302 | Tragic 92.7% |
| Guyanese | 0.0 /100 | #303 | Tragic 92.7% |
| Tohono O'odham | 0.0 /100 | #304 | Tragic 92.6% |
| Japanese | 0.0 /100 | #305 | Tragic 92.6% |
| Immigrants | Vietnam | 0.0 /100 | #306 | Tragic 92.6% |
| Immigrants | Immigrants | 0.0 /100 | #307 | Tragic 92.5% |
Demographics Similar to Dominicans by 9th Grade
In terms of 9th grade, the demographic groups most similar to Dominicans are Honduran (91.0%, a difference of 0.030%), Immigrants from Cabo Verde (90.9%, a difference of 0.15%), Mexican American Indian (90.9%, a difference of 0.18%), Hispanic or Latino (90.9%, a difference of 0.20%), and Immigrants from Yemen (90.8%, a difference of 0.29%).
| Demographics | Rating | Rank | 9th Grade |
| Immigrants | Ecuador | 0.0 /100 | #321 | Tragic 91.8% |
| Belizeans | 0.0 /100 | #322 | Tragic 91.8% |
| Puerto Ricans | 0.0 /100 | #323 | Tragic 91.8% |
| Immigrants | Belize | 0.0 /100 | #324 | Tragic 91.8% |
| Central American Indians | 0.0 /100 | #325 | Tragic 91.5% |
| Immigrants | Armenia | 0.0 /100 | #326 | Tragic 91.4% |
| Immigrants | Nicaragua | 0.0 /100 | #327 | Tragic 91.3% |
| Dominicans | 0.0 /100 | #328 | Tragic 91.1% |
| Hondurans | 0.0 /100 | #329 | Tragic 91.0% |
| Immigrants | Cabo Verde | 0.0 /100 | #330 | Tragic 90.9% |
| Mexican American Indians | 0.0 /100 | #331 | Tragic 90.9% |
| Hispanics or Latinos | 0.0 /100 | #332 | Tragic 90.9% |
| Immigrants | Yemen | 0.0 /100 | #333 | Tragic 90.8% |
| Immigrants | Azores | 0.0 /100 | #334 | Tragic 90.8% |
| Immigrants | Honduras | 0.0 /100 | #335 | Tragic 90.6% |