Dominican vs Welsh Single Mother Poverty
COMPARE
Dominican
Welsh
Single Mother Poverty
Single Mother Poverty Comparison
Dominicans
Welsh
34.5%
SINGLE MOTHER POVERTY
0.0/ 100
METRIC RATING
316th/ 347
METRIC RANK
30.4%
SINGLE MOTHER POVERTY
3.2/ 100
METRIC RATING
236th/ 347
METRIC RANK
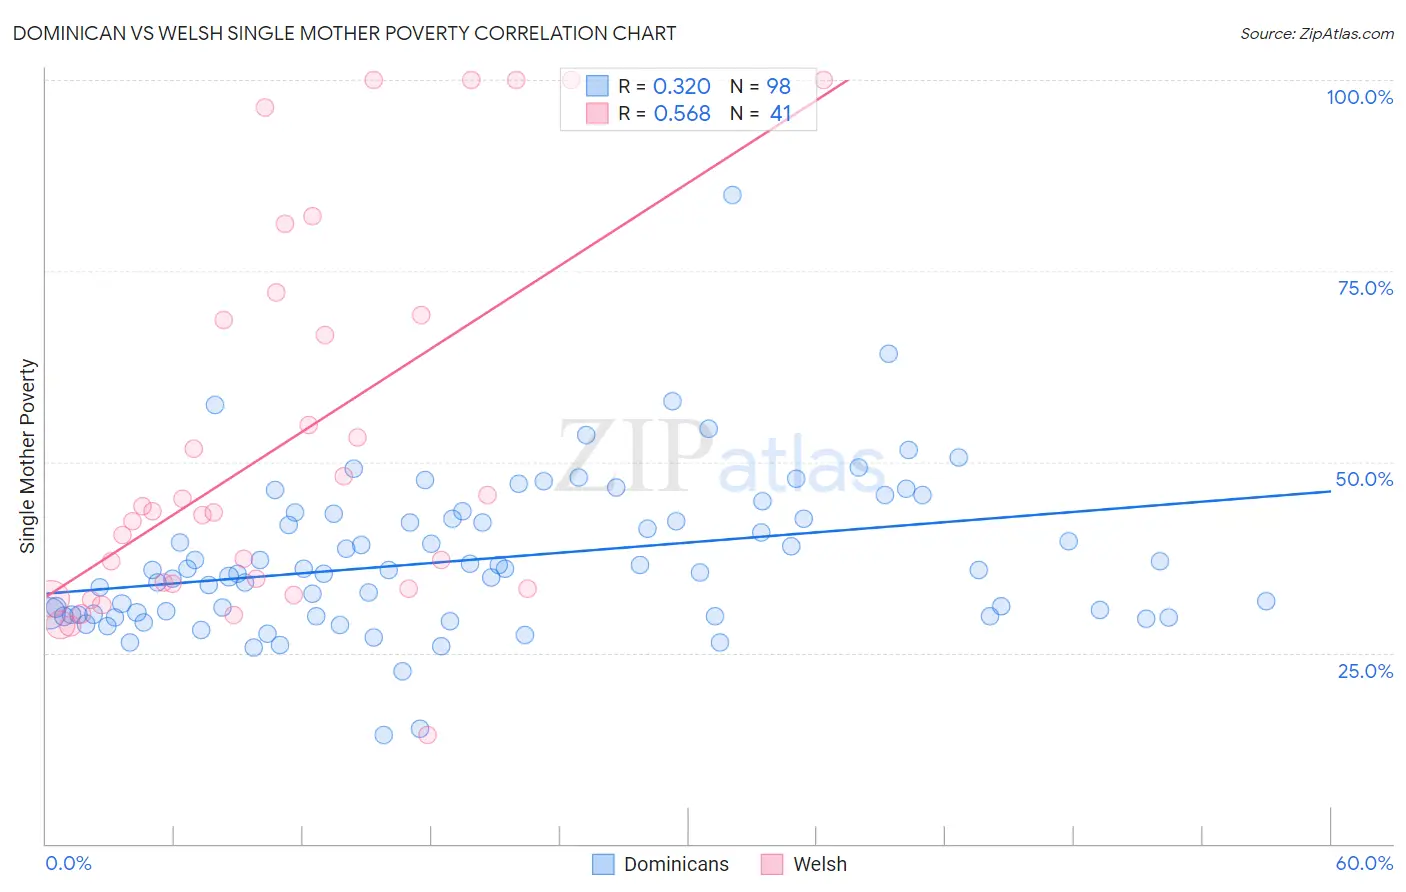
Dominican vs Welsh Single Mother Poverty Correlation Chart
The statistical analysis conducted on geographies consisting of 347,165,672 people shows a mild positive correlation between the proportion of Dominicans and poverty level among single mothers in the United States with a correlation coefficient (R) of 0.320 and weighted average of 34.5%. Similarly, the statistical analysis conducted on geographies consisting of 506,398,542 people shows a substantial positive correlation between the proportion of Welsh and poverty level among single mothers in the United States with a correlation coefficient (R) of 0.568 and weighted average of 30.4%, a difference of 13.6%.
Single Mother Poverty Correlation Summary
| Measurement | Dominican | Welsh |
| Minimum | 14.2% | 14.3% |
| Maximum | 84.9% | 100.0% |
| Range | 70.7% | 85.7% |
| Mean | 37.2% | 52.0% |
| Median | 35.8% | 43.3% |
| Interquartile 25% (IQ1) | 30.0% | 33.3% |
| Interquartile 75% (IQ3) | 42.5% | 68.9% |
| Interquartile Range (IQR) | 12.6% | 35.6% |
| Standard Deviation (Sample) | 10.2% | 24.7% |
| Standard Deviation (Population) | 10.1% | 24.4% |
Similar Demographics by Single Mother Poverty
Demographics Similar to Dominicans by Single Mother Poverty
In terms of single mother poverty, the demographic groups most similar to Dominicans are Cherokee (34.5%, a difference of 0.11%), Hopi (34.5%, a difference of 0.12%), Chickasaw (34.4%, a difference of 0.20%), Immigrants from Dominican Republic (34.4%, a difference of 0.37%), and Central American Indian (34.3%, a difference of 0.45%).
| Demographics | Rating | Rank | Single Mother Poverty |
| Potawatomi | 0.0 /100 | #309 | Tragic 34.1% |
| Hondurans | 0.0 /100 | #310 | Tragic 34.2% |
| Alsatians | 0.0 /100 | #311 | Tragic 34.3% |
| Central American Indians | 0.0 /100 | #312 | Tragic 34.3% |
| Immigrants | Dominican Republic | 0.0 /100 | #313 | Tragic 34.4% |
| Chickasaw | 0.0 /100 | #314 | Tragic 34.4% |
| Hopi | 0.0 /100 | #315 | Tragic 34.5% |
| Dominicans | 0.0 /100 | #316 | Tragic 34.5% |
| Cherokee | 0.0 /100 | #317 | Tragic 34.5% |
| Immigrants | Honduras | 0.0 /100 | #318 | Tragic 34.7% |
| Chippewa | 0.0 /100 | #319 | Tragic 34.8% |
| Iroquois | 0.0 /100 | #320 | Tragic 34.8% |
| Paiute | 0.0 /100 | #321 | Tragic 35.1% |
| Blacks/African Americans | 0.0 /100 | #322 | Tragic 35.2% |
| Kiowa | 0.0 /100 | #323 | Tragic 35.5% |
Demographics Similar to Welsh by Single Mother Poverty
In terms of single mother poverty, the demographic groups most similar to Welsh are Immigrants from St. Vincent and the Grenadines (30.4%, a difference of 0.050%), Immigrants from Grenada (30.3%, a difference of 0.070%), Immigrants from Middle Africa (30.3%, a difference of 0.10%), Immigrants from Nicaragua (30.3%, a difference of 0.10%), and Slovak (30.4%, a difference of 0.16%).
| Demographics | Rating | Rank | Single Mother Poverty |
| Immigrants | Barbados | 5.0 /100 | #229 | Tragic 30.2% |
| English | 4.8 /100 | #230 | Tragic 30.2% |
| Dutch | 4.3 /100 | #231 | Tragic 30.2% |
| Alaskan Athabascans | 4.1 /100 | #232 | Tragic 30.3% |
| Immigrants | Middle Africa | 3.5 /100 | #233 | Tragic 30.3% |
| Immigrants | Nicaragua | 3.5 /100 | #234 | Tragic 30.3% |
| Immigrants | Grenada | 3.4 /100 | #235 | Tragic 30.3% |
| Welsh | 3.2 /100 | #236 | Tragic 30.4% |
| Immigrants | St. Vincent and the Grenadines | 3.1 /100 | #237 | Tragic 30.4% |
| Slovaks | 2.8 /100 | #238 | Tragic 30.4% |
| Immigrants | Portugal | 2.1 /100 | #239 | Tragic 30.5% |
| Salvadorans | 1.8 /100 | #240 | Tragic 30.6% |
| Immigrants | Laos | 1.8 /100 | #241 | Tragic 30.6% |
| Immigrants | Burma/Myanmar | 1.7 /100 | #242 | Tragic 30.6% |
| Bermudans | 1.6 /100 | #243 | Tragic 30.6% |