Guamanian/Chamorro vs Welsh Single Mother Poverty
COMPARE
Guamanian/Chamorro
Welsh
Single Mother Poverty
Single Mother Poverty Comparison
Guamanians/Chamorros
Welsh
29.4%
SINGLE MOTHER POVERTY
31.8/ 100
METRIC RATING
188th/ 347
METRIC RANK
30.4%
SINGLE MOTHER POVERTY
3.2/ 100
METRIC RATING
236th/ 347
METRIC RANK
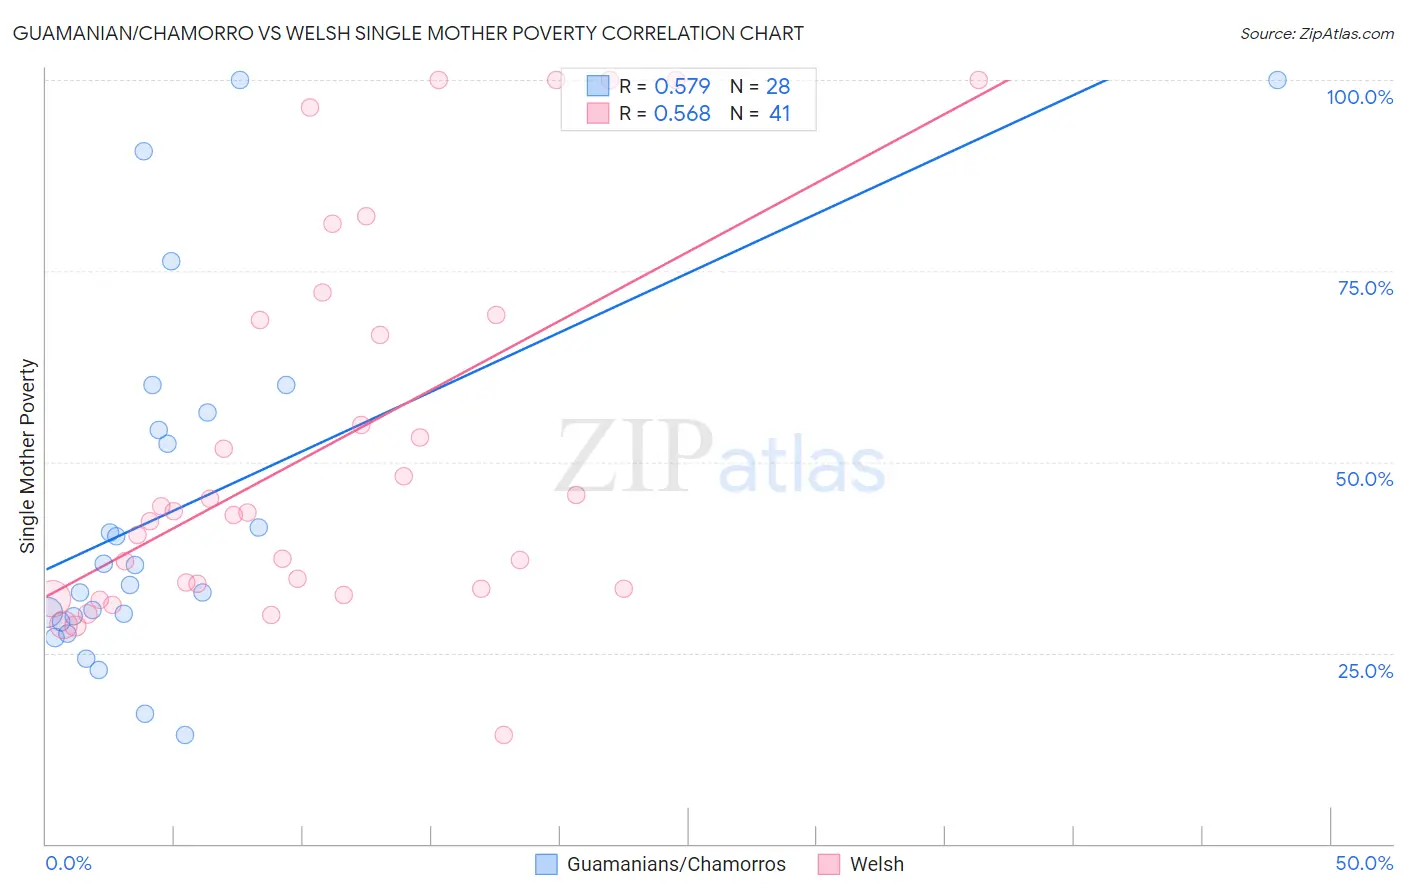
Guamanian/Chamorro vs Welsh Single Mother Poverty Correlation Chart
The statistical analysis conducted on geographies consisting of 219,675,506 people shows a substantial positive correlation between the proportion of Guamanians/Chamorros and poverty level among single mothers in the United States with a correlation coefficient (R) of 0.579 and weighted average of 29.4%. Similarly, the statistical analysis conducted on geographies consisting of 506,398,542 people shows a substantial positive correlation between the proportion of Welsh and poverty level among single mothers in the United States with a correlation coefficient (R) of 0.568 and weighted average of 30.4%, a difference of 3.1%.
Single Mother Poverty Correlation Summary
| Measurement | Guamanian/Chamorro | Welsh |
| Minimum | 14.3% | 14.3% |
| Maximum | 100.0% | 100.0% |
| Range | 85.7% | 85.7% |
| Mean | 43.9% | 52.0% |
| Median | 35.2% | 43.3% |
| Interquartile 25% (IQ1) | 29.4% | 33.3% |
| Interquartile 75% (IQ3) | 55.3% | 68.9% |
| Interquartile Range (IQR) | 25.8% | 35.6% |
| Standard Deviation (Sample) | 23.4% | 24.7% |
| Standard Deviation (Population) | 23.0% | 24.4% |
Similar Demographics by Single Mother Poverty
Demographics Similar to Guamanians/Chamorros by Single Mother Poverty
In terms of single mother poverty, the demographic groups most similar to Guamanians/Chamorros are Immigrants from Africa (29.4%, a difference of 0.010%), Lebanese (29.4%, a difference of 0.040%), Immigrants from Germany (29.5%, a difference of 0.070%), Immigrants from Trinidad and Tobago (29.5%, a difference of 0.14%), and Moroccan (29.5%, a difference of 0.18%).
| Demographics | Rating | Rank | Single Mother Poverty |
| Canadians | 40.4 /100 | #181 | Average 29.3% |
| Immigrants | Eastern Africa | 38.5 /100 | #182 | Fair 29.3% |
| Nepalese | 38.3 /100 | #183 | Fair 29.3% |
| Nigerians | 38.0 /100 | #184 | Fair 29.3% |
| Ghanaians | 36.8 /100 | #185 | Fair 29.4% |
| Yugoslavians | 36.0 /100 | #186 | Fair 29.4% |
| Lebanese | 32.5 /100 | #187 | Fair 29.4% |
| Guamanians/Chamorros | 31.8 /100 | #188 | Fair 29.4% |
| Immigrants | Africa | 31.6 /100 | #189 | Fair 29.4% |
| Immigrants | Germany | 30.4 /100 | #190 | Fair 29.5% |
| Immigrants | Trinidad and Tobago | 29.2 /100 | #191 | Fair 29.5% |
| Moroccans | 28.6 /100 | #192 | Fair 29.5% |
| Basques | 28.3 /100 | #193 | Fair 29.5% |
| Icelanders | 26.1 /100 | #194 | Fair 29.5% |
| Slavs | 24.5 /100 | #195 | Fair 29.6% |
Demographics Similar to Welsh by Single Mother Poverty
In terms of single mother poverty, the demographic groups most similar to Welsh are Immigrants from St. Vincent and the Grenadines (30.4%, a difference of 0.050%), Immigrants from Grenada (30.3%, a difference of 0.070%), Immigrants from Middle Africa (30.3%, a difference of 0.10%), Immigrants from Nicaragua (30.3%, a difference of 0.10%), and Slovak (30.4%, a difference of 0.16%).
| Demographics | Rating | Rank | Single Mother Poverty |
| Immigrants | Barbados | 5.0 /100 | #229 | Tragic 30.2% |
| English | 4.8 /100 | #230 | Tragic 30.2% |
| Dutch | 4.3 /100 | #231 | Tragic 30.2% |
| Alaskan Athabascans | 4.1 /100 | #232 | Tragic 30.3% |
| Immigrants | Middle Africa | 3.5 /100 | #233 | Tragic 30.3% |
| Immigrants | Nicaragua | 3.5 /100 | #234 | Tragic 30.3% |
| Immigrants | Grenada | 3.4 /100 | #235 | Tragic 30.3% |
| Welsh | 3.2 /100 | #236 | Tragic 30.4% |
| Immigrants | St. Vincent and the Grenadines | 3.1 /100 | #237 | Tragic 30.4% |
| Slovaks | 2.8 /100 | #238 | Tragic 30.4% |
| Immigrants | Portugal | 2.1 /100 | #239 | Tragic 30.5% |
| Salvadorans | 1.8 /100 | #240 | Tragic 30.6% |
| Immigrants | Laos | 1.8 /100 | #241 | Tragic 30.6% |
| Immigrants | Burma/Myanmar | 1.7 /100 | #242 | Tragic 30.6% |
| Bermudans | 1.6 /100 | #243 | Tragic 30.6% |