White/Caucasian vs Welsh Vision Disability
COMPARE
White/Caucasian
Welsh
Vision Disability
Vision Disability Comparison
Whites/Caucasians
Welsh
2.4%
VISION DISABILITY
0.2/ 100
METRIC RATING
259th/ 347
METRIC RANK
2.3%
VISION DISABILITY
2.3/ 100
METRIC RATING
229th/ 347
METRIC RANK
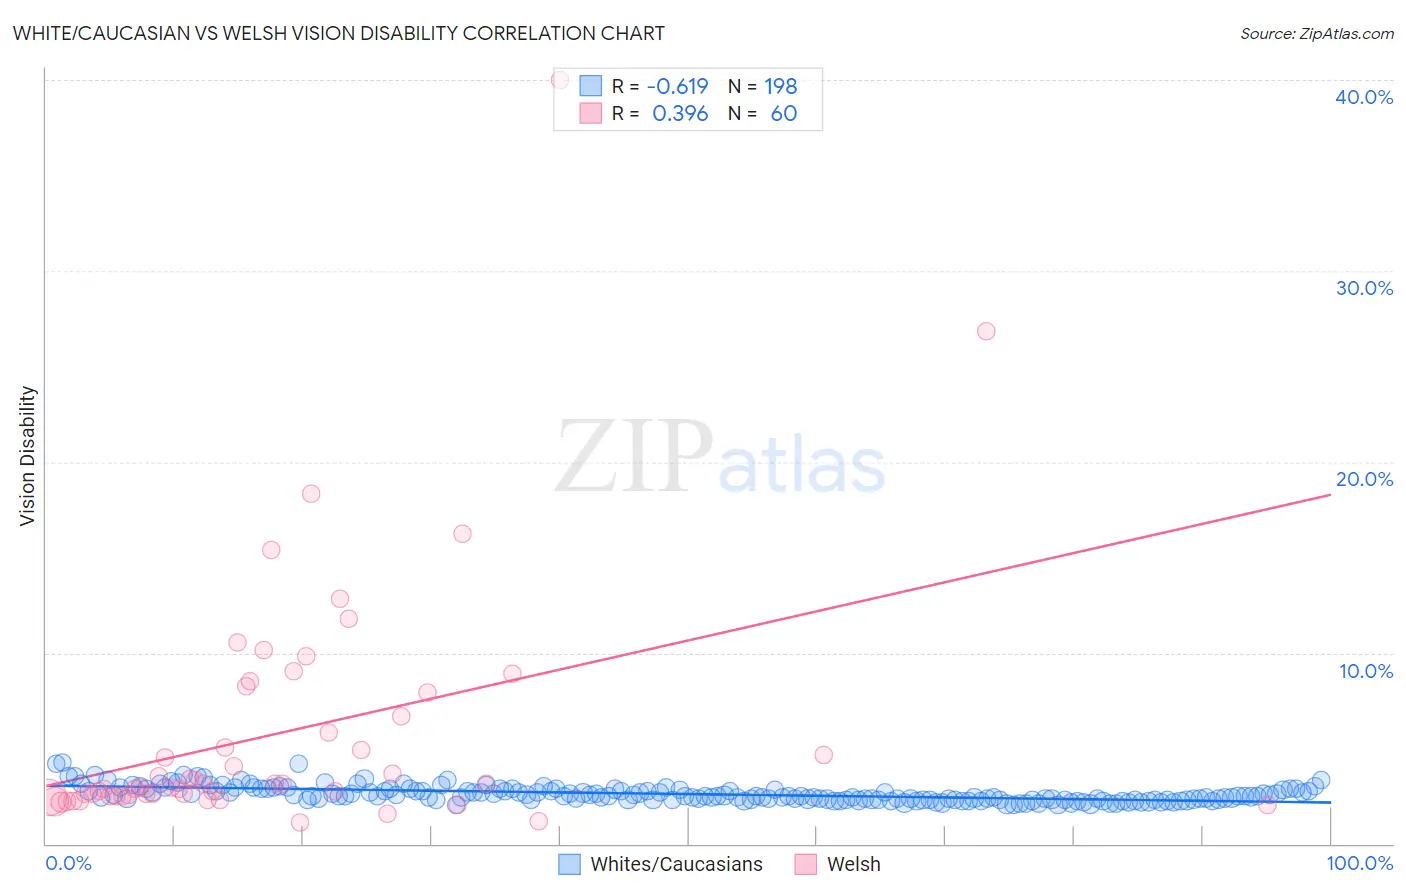
White/Caucasian vs Welsh Vision Disability Correlation Chart
The statistical analysis conducted on geographies consisting of 580,529,348 people shows a significant negative correlation between the proportion of Whites/Caucasians and percentage of population with vision disability in the United States with a correlation coefficient (R) of -0.619 and weighted average of 2.4%. Similarly, the statistical analysis conducted on geographies consisting of 527,426,081 people shows a mild positive correlation between the proportion of Welsh and percentage of population with vision disability in the United States with a correlation coefficient (R) of 0.396 and weighted average of 2.3%, a difference of 3.7%.
Vision Disability Correlation Summary
| Measurement | White/Caucasian | Welsh |
| Minimum | 2.0% | 1.1% |
| Maximum | 4.3% | 40.0% |
| Range | 2.2% | 38.9% |
| Mean | 2.6% | 5.8% |
| Median | 2.5% | 3.0% |
| Interquartile 25% (IQ1) | 2.3% | 2.5% |
| Interquartile 75% (IQ3) | 2.8% | 7.3% |
| Interquartile Range (IQR) | 0.50% | 4.8% |
| Standard Deviation (Sample) | 0.41% | 6.6% |
| Standard Deviation (Population) | 0.41% | 6.5% |
Similar Demographics by Vision Disability
Demographics Similar to Whites/Caucasians by Vision Disability
In terms of vision disability, the demographic groups most similar to Whites/Caucasians are British West Indian (2.4%, a difference of 0.010%), West Indian (2.4%, a difference of 0.040%), Immigrants from Haiti (2.4%, a difference of 0.12%), Belizean (2.4%, a difference of 0.17%), and Fijian (2.4%, a difference of 0.38%).
| Demographics | Rating | Rank | Vision Disability |
| Immigrants | Micronesia | 0.3 /100 | #252 | Tragic 2.4% |
| Japanese | 0.3 /100 | #253 | Tragic 2.4% |
| Haitians | 0.3 /100 | #254 | Tragic 2.4% |
| Immigrants | Guatemala | 0.3 /100 | #255 | Tragic 2.4% |
| Immigrants | Haiti | 0.2 /100 | #256 | Tragic 2.4% |
| West Indians | 0.2 /100 | #257 | Tragic 2.4% |
| British West Indians | 0.2 /100 | #258 | Tragic 2.4% |
| Whites/Caucasians | 0.2 /100 | #259 | Tragic 2.4% |
| Belizeans | 0.2 /100 | #260 | Tragic 2.4% |
| Fijians | 0.1 /100 | #261 | Tragic 2.4% |
| Jamaicans | 0.1 /100 | #262 | Tragic 2.4% |
| Immigrants | Belize | 0.1 /100 | #263 | Tragic 2.4% |
| Immigrants | Liberia | 0.1 /100 | #264 | Tragic 2.4% |
| Immigrants | Jamaica | 0.1 /100 | #265 | Tragic 2.4% |
| Mexican American Indians | 0.1 /100 | #266 | Tragic 2.4% |
Demographics Similar to Welsh by Vision Disability
In terms of vision disability, the demographic groups most similar to Welsh are Nicaraguan (2.3%, a difference of 0.070%), Hmong (2.3%, a difference of 0.080%), Immigrants from Ecuador (2.3%, a difference of 0.23%), Hawaiian (2.3%, a difference of 0.32%), and Immigrants from Germany (2.3%, a difference of 0.37%).
| Demographics | Rating | Rank | Vision Disability |
| Immigrants | Senegal | 3.8 /100 | #222 | Tragic 2.3% |
| Basques | 3.5 /100 | #223 | Tragic 2.3% |
| Irish | 3.4 /100 | #224 | Tragic 2.3% |
| Immigrants | Western Africa | 3.4 /100 | #225 | Tragic 2.3% |
| Immigrants | Germany | 3.0 /100 | #226 | Tragic 2.3% |
| Hawaiians | 2.9 /100 | #227 | Tragic 2.3% |
| Hmong | 2.5 /100 | #228 | Tragic 2.3% |
| Welsh | 2.3 /100 | #229 | Tragic 2.3% |
| Nicaraguans | 2.2 /100 | #230 | Tragic 2.3% |
| Immigrants | Ecuador | 2.0 /100 | #231 | Tragic 2.3% |
| German Russians | 1.8 /100 | #232 | Tragic 2.3% |
| Central Americans | 1.8 /100 | #233 | Tragic 2.3% |
| Scottish | 1.6 /100 | #234 | Tragic 2.3% |
| Marshallese | 1.5 /100 | #235 | Tragic 2.3% |
| Immigrants | Congo | 1.4 /100 | #236 | Tragic 2.3% |