Arab vs Welsh Single Mother Poverty
COMPARE
Arab
Welsh
Single Mother Poverty
Single Mother Poverty Comparison
Arabs
Welsh
29.0%
SINGLE MOTHER POVERTY
60.7/ 100
METRIC RATING
165th/ 347
METRIC RANK
30.4%
SINGLE MOTHER POVERTY
3.2/ 100
METRIC RATING
236th/ 347
METRIC RANK
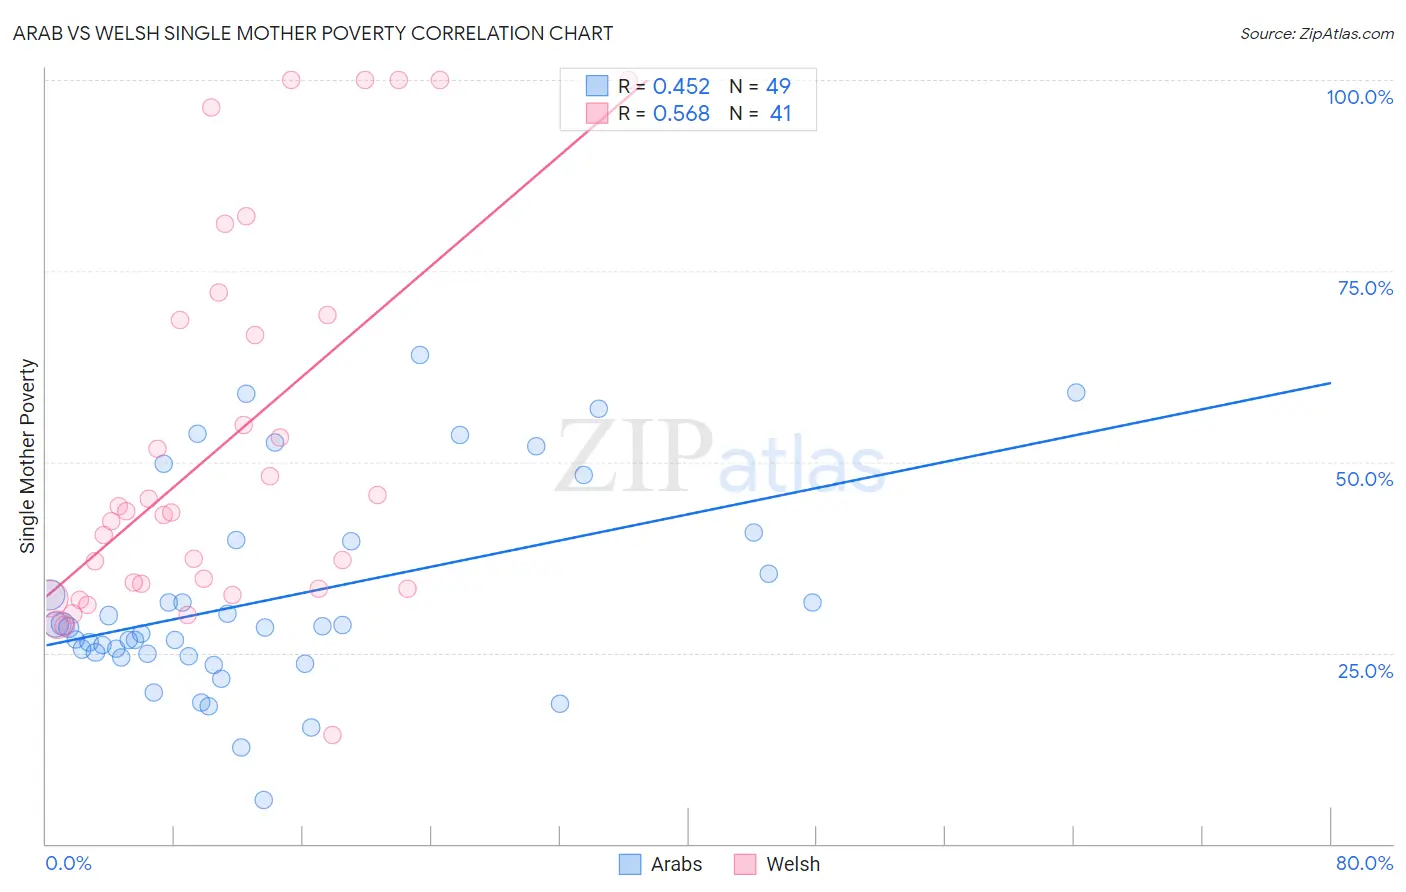
Arab vs Welsh Single Mother Poverty Correlation Chart
The statistical analysis conducted on geographies consisting of 470,668,307 people shows a moderate positive correlation between the proportion of Arabs and poverty level among single mothers in the United States with a correlation coefficient (R) of 0.452 and weighted average of 29.0%. Similarly, the statistical analysis conducted on geographies consisting of 506,398,542 people shows a substantial positive correlation between the proportion of Welsh and poverty level among single mothers in the United States with a correlation coefficient (R) of 0.568 and weighted average of 30.4%, a difference of 4.6%.
Single Mother Poverty Correlation Summary
| Measurement | Arab | Welsh |
| Minimum | 5.8% | 14.3% |
| Maximum | 63.9% | 100.0% |
| Range | 58.1% | 85.7% |
| Mean | 32.2% | 52.0% |
| Median | 28.4% | 43.3% |
| Interquartile 25% (IQ1) | 24.8% | 33.3% |
| Interquartile 75% (IQ3) | 39.7% | 68.9% |
| Interquartile Range (IQR) | 14.9% | 35.6% |
| Standard Deviation (Sample) | 13.3% | 24.7% |
| Standard Deviation (Population) | 13.2% | 24.4% |
Similar Demographics by Single Mother Poverty
Demographics Similar to Arabs by Single Mother Poverty
In terms of single mother poverty, the demographic groups most similar to Arabs are Inupiat (29.0%, a difference of 0.020%), Costa Rican (29.0%, a difference of 0.12%), European (29.1%, a difference of 0.16%), Immigrants from Uruguay (29.1%, a difference of 0.17%), and Immigrants from Nigeria (28.9%, a difference of 0.27%).
| Demographics | Rating | Rank | Single Mother Poverty |
| Immigrants | Hungary | 70.6 /100 | #158 | Good 28.9% |
| Czechs | 68.4 /100 | #159 | Good 28.9% |
| Japanese | 68.0 /100 | #160 | Good 28.9% |
| Immigrants | Cambodia | 66.6 /100 | #161 | Good 28.9% |
| Scandinavians | 66.2 /100 | #162 | Good 28.9% |
| Immigrants | Nigeria | 65.9 /100 | #163 | Good 28.9% |
| Immigrants | Kenya | 65.9 /100 | #164 | Good 28.9% |
| Arabs | 60.7 /100 | #165 | Good 29.0% |
| Inupiat | 60.4 /100 | #166 | Good 29.0% |
| Costa Ricans | 58.4 /100 | #167 | Average 29.0% |
| Europeans | 57.6 /100 | #168 | Average 29.1% |
| Immigrants | Uruguay | 57.2 /100 | #169 | Average 29.1% |
| New Zealanders | 55.1 /100 | #170 | Average 29.1% |
| Puget Sound Salish | 55.1 /100 | #171 | Average 29.1% |
| Carpatho Rusyns | 53.8 /100 | #172 | Average 29.1% |
Demographics Similar to Welsh by Single Mother Poverty
In terms of single mother poverty, the demographic groups most similar to Welsh are Immigrants from St. Vincent and the Grenadines (30.4%, a difference of 0.050%), Immigrants from Grenada (30.3%, a difference of 0.070%), Immigrants from Middle Africa (30.3%, a difference of 0.10%), Immigrants from Nicaragua (30.3%, a difference of 0.10%), and Slovak (30.4%, a difference of 0.16%).
| Demographics | Rating | Rank | Single Mother Poverty |
| Immigrants | Barbados | 5.0 /100 | #229 | Tragic 30.2% |
| English | 4.8 /100 | #230 | Tragic 30.2% |
| Dutch | 4.3 /100 | #231 | Tragic 30.2% |
| Alaskan Athabascans | 4.1 /100 | #232 | Tragic 30.3% |
| Immigrants | Middle Africa | 3.5 /100 | #233 | Tragic 30.3% |
| Immigrants | Nicaragua | 3.5 /100 | #234 | Tragic 30.3% |
| Immigrants | Grenada | 3.4 /100 | #235 | Tragic 30.3% |
| Welsh | 3.2 /100 | #236 | Tragic 30.4% |
| Immigrants | St. Vincent and the Grenadines | 3.1 /100 | #237 | Tragic 30.4% |
| Slovaks | 2.8 /100 | #238 | Tragic 30.4% |
| Immigrants | Portugal | 2.1 /100 | #239 | Tragic 30.5% |
| Salvadorans | 1.8 /100 | #240 | Tragic 30.6% |
| Immigrants | Laos | 1.8 /100 | #241 | Tragic 30.6% |
| Immigrants | Burma/Myanmar | 1.7 /100 | #242 | Tragic 30.6% |
| Bermudans | 1.6 /100 | #243 | Tragic 30.6% |