White/Caucasian vs Hmong Unemployment Among Seniors over 65 years
COMPARE
White/Caucasian
Hmong
Unemployment Among Seniors over 65 years
Unemployment Among Seniors over 65 years Comparison
Whites/Caucasians
Hmong
5.1%
UNEMPLOYMENT AMONG SENIORS OVER 65 YEARS
84.4/ 100
METRIC RATING
136th/ 347
METRIC RANK
4.2%
UNEMPLOYMENT AMONG SENIORS OVER 65 YEARS
100.0/ 100
METRIC RATING
2nd/ 347
METRIC RANK
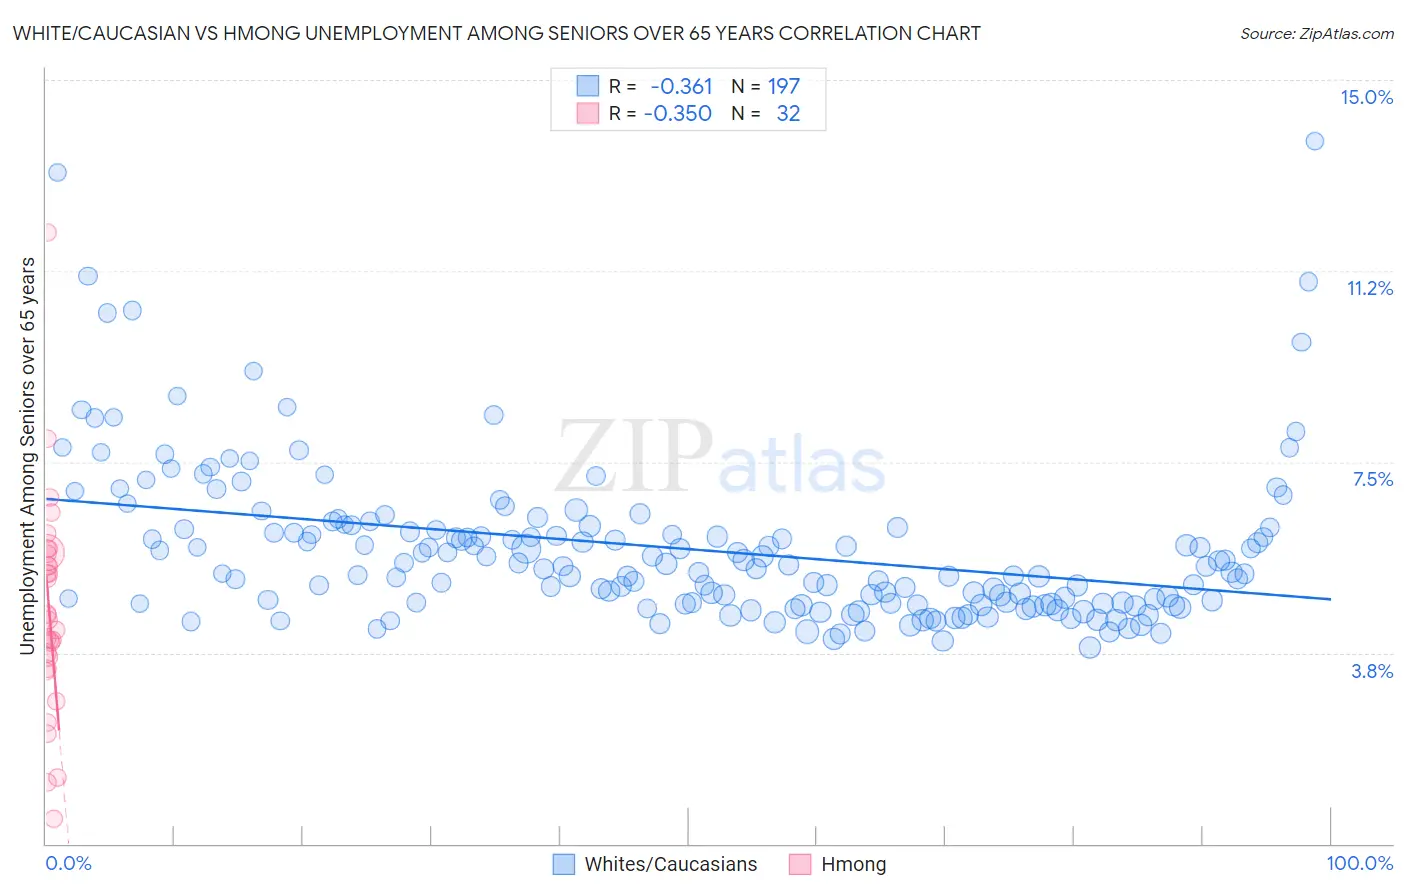
White/Caucasian vs Hmong Unemployment Among Seniors over 65 years Correlation Chart
The statistical analysis conducted on geographies consisting of 465,209,584 people shows a mild negative correlation between the proportion of Whites/Caucasians and unemployment rate amomg seniors over the age of 65 in the United States with a correlation coefficient (R) of -0.361 and weighted average of 5.1%. Similarly, the statistical analysis conducted on geographies consisting of 24,334,539 people shows a mild negative correlation between the proportion of Hmong and unemployment rate amomg seniors over the age of 65 in the United States with a correlation coefficient (R) of -0.350 and weighted average of 4.2%, a difference of 19.9%.
Unemployment Among Seniors over 65 years Correlation Summary
| Measurement | White/Caucasian | Hmong |
| Minimum | 3.9% | 0.50% |
| Maximum | 13.8% | 12.0% |
| Range | 9.9% | 11.5% |
| Mean | 5.8% | 4.6% |
| Median | 5.5% | 4.5% |
| Interquartile 25% (IQ1) | 4.7% | 3.6% |
| Interquartile 75% (IQ3) | 6.2% | 5.7% |
| Interquartile Range (IQR) | 1.5% | 2.2% |
| Standard Deviation (Sample) | 1.6% | 2.2% |
| Standard Deviation (Population) | 1.6% | 2.1% |
Similar Demographics by Unemployment Among Seniors over 65 years
Demographics Similar to Whites/Caucasians by Unemployment Among Seniors over 65 years
In terms of unemployment among seniors over 65 years, the demographic groups most similar to Whites/Caucasians are Ukrainian (5.1%, a difference of 0.0%), Arab (5.1%, a difference of 0.0%), Turkish (5.1%, a difference of 0.030%), Syrian (5.1%, a difference of 0.060%), and New Zealander (5.1%, a difference of 0.070%).
| Demographics | Rating | Rank | Unemployment Among Seniors over 65 years |
| Immigrants | England | 86.7 /100 | #129 | Excellent 5.1% |
| Iranians | 86.6 /100 | #130 | Excellent 5.1% |
| Immigrants | Australia | 85.8 /100 | #131 | Excellent 5.1% |
| Chileans | 85.6 /100 | #132 | Excellent 5.1% |
| Syrians | 85.3 /100 | #133 | Excellent 5.1% |
| Turks | 84.9 /100 | #134 | Excellent 5.1% |
| Ukrainians | 84.4 /100 | #135 | Excellent 5.1% |
| Whites/Caucasians | 84.4 /100 | #136 | Excellent 5.1% |
| Arabs | 84.3 /100 | #137 | Excellent 5.1% |
| New Zealanders | 83.2 /100 | #138 | Excellent 5.1% |
| Immigrants | Panama | 83.0 /100 | #139 | Excellent 5.1% |
| Immigrants | Chile | 83.0 /100 | #140 | Excellent 5.1% |
| Cherokee | 81.6 /100 | #141 | Excellent 5.1% |
| Immigrants | Indonesia | 81.0 /100 | #142 | Excellent 5.1% |
| Senegalese | 80.4 /100 | #143 | Excellent 5.1% |
Demographics Similar to Hmong by Unemployment Among Seniors over 65 years
In terms of unemployment among seniors over 65 years, the demographic groups most similar to Hmong are Fijian (4.2%, a difference of 0.28%), Chinese (4.2%, a difference of 0.91%), Sudanese (4.4%, a difference of 4.0%), Chickasaw (4.4%, a difference of 4.1%), and Immigrants from Cuba (4.5%, a difference of 5.4%).
| Demographics | Rating | Rank | Unemployment Among Seniors over 65 years |
| Chinese | 100.0 /100 | #1 | Exceptional 4.2% |
| Hmong | 100.0 /100 | #2 | Exceptional 4.2% |
| Fijians | 100.0 /100 | #3 | Exceptional 4.2% |
| Sudanese | 100.0 /100 | #4 | Exceptional 4.4% |
| Chickasaw | 100.0 /100 | #5 | Exceptional 4.4% |
| Immigrants | Cuba | 100.0 /100 | #6 | Exceptional 4.5% |
| Immigrants | Congo | 100.0 /100 | #7 | Exceptional 4.5% |
| Tsimshian | 100.0 /100 | #8 | Exceptional 4.5% |
| Indonesians | 100.0 /100 | #9 | Exceptional 4.5% |
| Immigrants | Zaire | 100.0 /100 | #10 | Exceptional 4.5% |
| Comanche | 100.0 /100 | #11 | Exceptional 4.6% |
| Osage | 100.0 /100 | #12 | Exceptional 4.6% |
| Cubans | 100.0 /100 | #13 | Exceptional 4.6% |
| Menominee | 100.0 /100 | #14 | Exceptional 4.6% |
| Lumbee | 100.0 /100 | #15 | Exceptional 4.6% |