Immigrants from Uruguay vs Japanese Male Poverty
COMPARE
Immigrants from Uruguay
Japanese
Male Poverty
Male Poverty Comparison
Immigrants from Uruguay
Japanese
11.6%
MALE POVERTY
19.1/ 100
METRIC RATING
192nd/ 347
METRIC RANK
12.2%
MALE POVERTY
2.7/ 100
METRIC RATING
214th/ 347
METRIC RANK
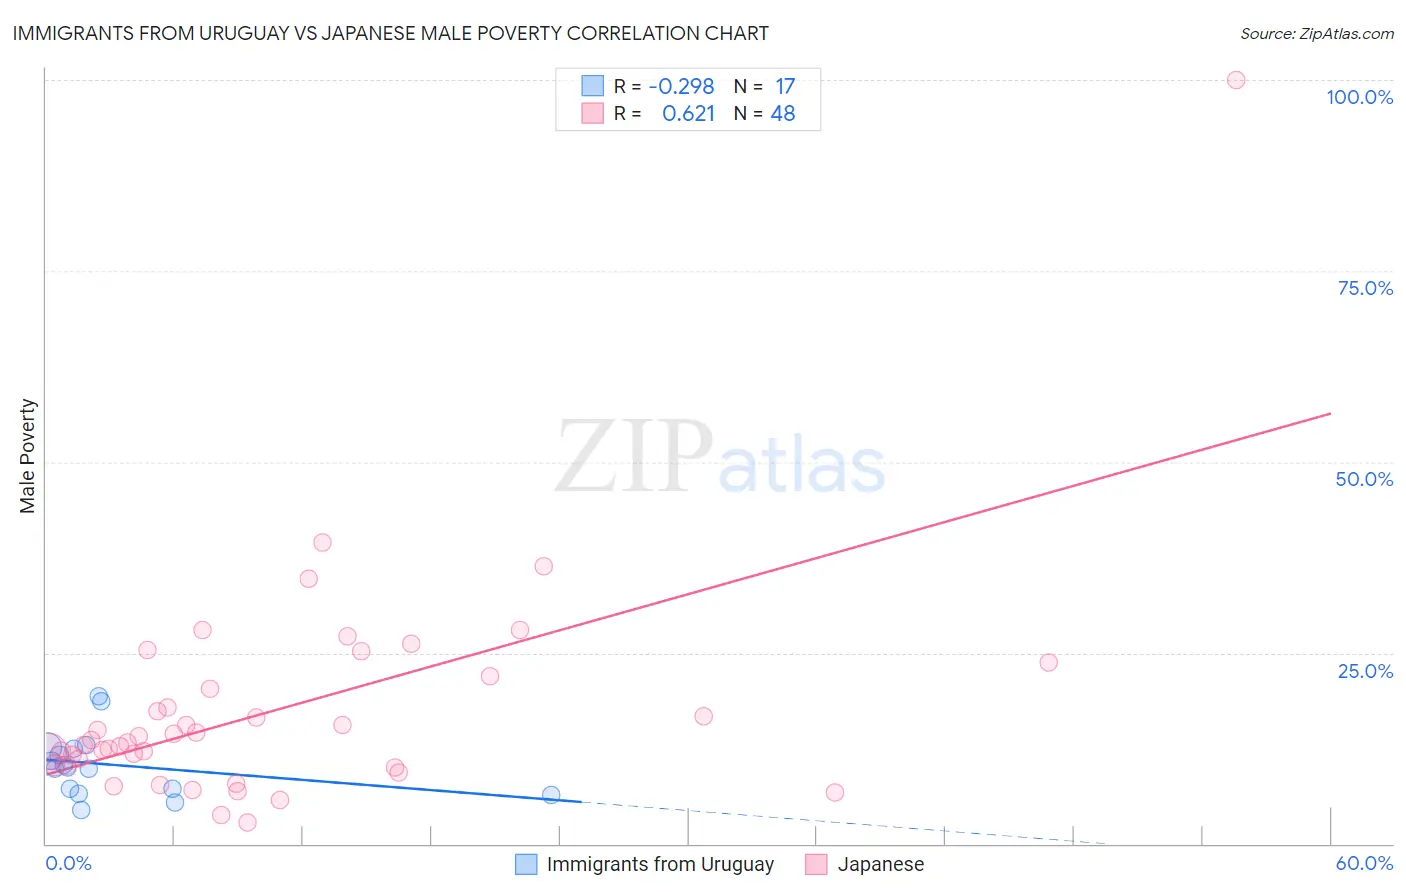
Immigrants from Uruguay vs Japanese Male Poverty Correlation Chart
The statistical analysis conducted on geographies consisting of 133,238,599 people shows a weak negative correlation between the proportion of Immigrants from Uruguay and poverty level among males in the United States with a correlation coefficient (R) of -0.298 and weighted average of 11.6%. Similarly, the statistical analysis conducted on geographies consisting of 249,058,138 people shows a significant positive correlation between the proportion of Japanese and poverty level among males in the United States with a correlation coefficient (R) of 0.621 and weighted average of 12.2%, a difference of 5.1%.
Male Poverty Correlation Summary
| Measurement | Immigrants from Uruguay | Japanese |
| Minimum | 4.5% | 2.8% |
| Maximum | 19.3% | 100.0% |
| Range | 14.8% | 97.2% |
| Mean | 10.3% | 17.5% |
| Median | 10.0% | 13.3% |
| Interquartile 25% (IQ1) | 6.9% | 10.3% |
| Interquartile 75% (IQ3) | 12.6% | 21.2% |
| Interquartile Range (IQR) | 5.7% | 10.9% |
| Standard Deviation (Sample) | 4.1% | 14.8% |
| Standard Deviation (Population) | 4.0% | 14.6% |
Similar Demographics by Male Poverty
Demographics Similar to Immigrants from Uruguay by Male Poverty
In terms of male poverty, the demographic groups most similar to Immigrants from Uruguay are Immigrants from Kuwait (11.6%, a difference of 0.29%), Immigrants from Kenya (11.6%, a difference of 0.50%), South American Indian (11.5%, a difference of 0.52%), Arab (11.6%, a difference of 0.55%), and Hmong (11.6%, a difference of 0.56%).
| Demographics | Rating | Rank | Male Poverty |
| Immigrants | Afghanistan | 33.3 /100 | #185 | Fair 11.4% |
| Immigrants | Sierra Leone | 32.9 /100 | #186 | Fair 11.4% |
| Immigrants | Iraq | 31.9 /100 | #187 | Fair 11.4% |
| Sierra Leoneans | 29.9 /100 | #188 | Fair 11.4% |
| Hawaiians | 28.3 /100 | #189 | Fair 11.4% |
| Israelis | 26.1 /100 | #190 | Fair 11.5% |
| South American Indians | 22.8 /100 | #191 | Fair 11.5% |
| Immigrants | Uruguay | 19.1 /100 | #192 | Poor 11.6% |
| Immigrants | Kuwait | 17.3 /100 | #193 | Poor 11.6% |
| Immigrants | Kenya | 16.1 /100 | #194 | Poor 11.6% |
| Arabs | 15.8 /100 | #195 | Poor 11.6% |
| Hmong | 15.8 /100 | #196 | Poor 11.6% |
| Delaware | 15.4 /100 | #197 | Poor 11.7% |
| Iraqis | 14.7 /100 | #198 | Poor 11.7% |
| Spanish | 14.1 /100 | #199 | Poor 11.7% |
Demographics Similar to Japanese by Male Poverty
In terms of male poverty, the demographic groups most similar to Japanese are Immigrants from Uzbekistan (12.2%, a difference of 0.12%), Immigrants from Cambodia (12.2%, a difference of 0.20%), Immigrants from Thailand (12.2%, a difference of 0.21%), German Russian (12.2%, a difference of 0.23%), and Bermudan (12.2%, a difference of 0.30%).
| Demographics | Rating | Rank | Male Poverty |
| Malaysians | 5.2 /100 | #207 | Tragic 12.0% |
| Immigrants | Immigrants | 4.5 /100 | #208 | Tragic 12.0% |
| Immigrants | Azores | 4.3 /100 | #209 | Tragic 12.0% |
| Moroccans | 4.2 /100 | #210 | Tragic 12.0% |
| Immigrants | Panama | 4.0 /100 | #211 | Tragic 12.1% |
| Americans | 3.2 /100 | #212 | Tragic 12.1% |
| Immigrants | Nonimmigrants | 3.1 /100 | #213 | Tragic 12.1% |
| Japanese | 2.7 /100 | #214 | Tragic 12.2% |
| Immigrants | Uzbekistan | 2.6 /100 | #215 | Tragic 12.2% |
| Immigrants | Cambodia | 2.5 /100 | #216 | Tragic 12.2% |
| Immigrants | Thailand | 2.5 /100 | #217 | Tragic 12.2% |
| German Russians | 2.5 /100 | #218 | Tragic 12.2% |
| Bermudans | 2.4 /100 | #219 | Tragic 12.2% |
| Immigrants | Eritrea | 2.4 /100 | #220 | Tragic 12.2% |
| Ugandans | 2.2 /100 | #221 | Tragic 12.2% |