Welsh vs Japanese No Vehicles in Household
COMPARE
Welsh
Japanese
No Vehicles in Household
No Vehicles in Household Comparison
Welsh
Japanese
7.2%
NO VEHICLES IN HOUSEHOLD
100.0/ 100
METRIC RATING
17th/ 347
METRIC RANK
9.4%
NO VEHICLES IN HOUSEHOLD
94.1/ 100
METRIC RATING
116th/ 347
METRIC RANK
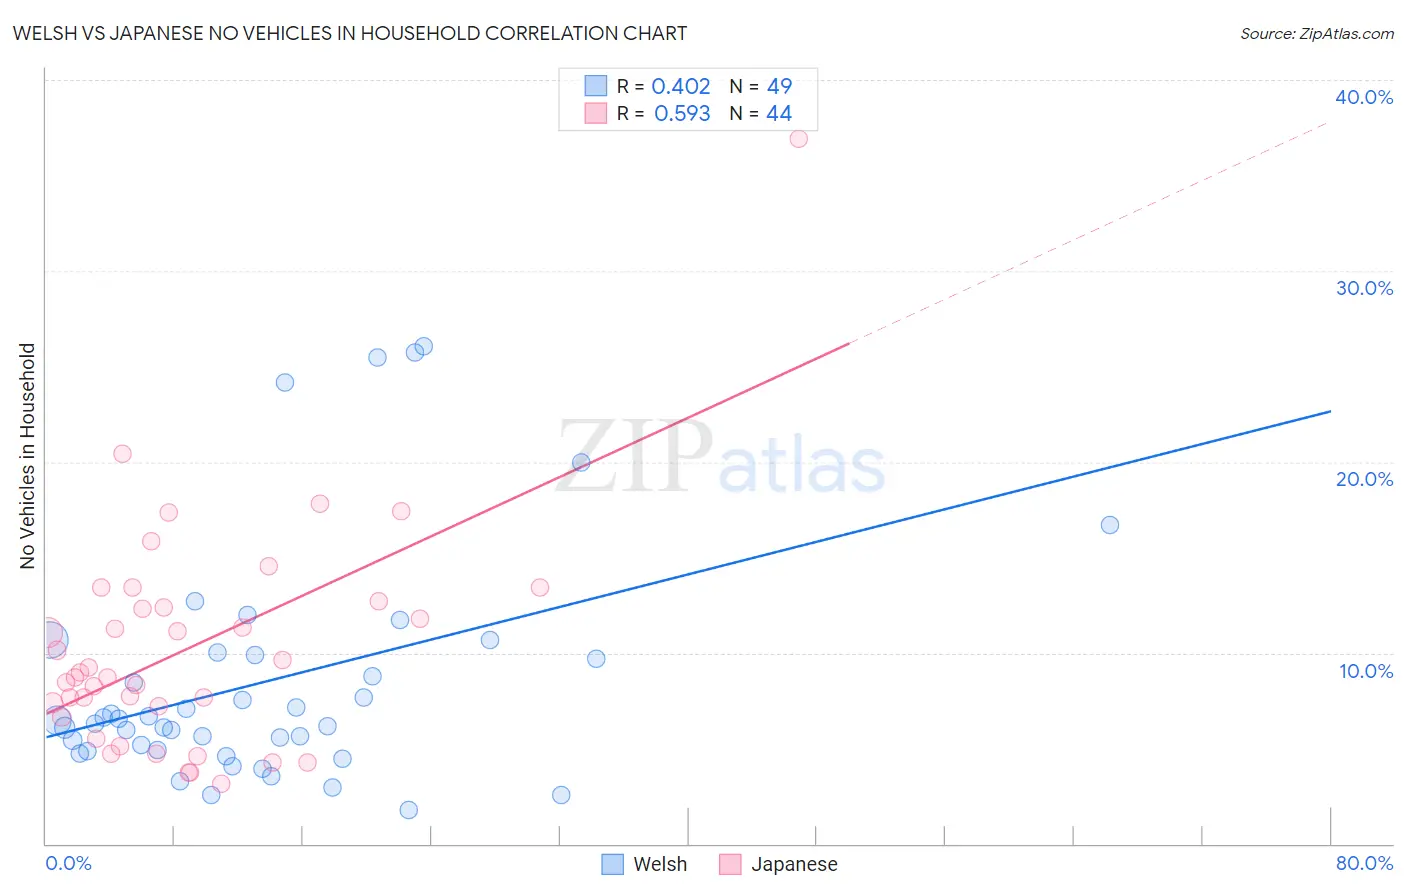
Welsh vs Japanese No Vehicles in Household Correlation Chart
The statistical analysis conducted on geographies consisting of 524,885,913 people shows a moderate positive correlation between the proportion of Welsh and percentage of households with no vehicle available in the United States with a correlation coefficient (R) of 0.402 and weighted average of 7.2%. Similarly, the statistical analysis conducted on geographies consisting of 248,891,204 people shows a substantial positive correlation between the proportion of Japanese and percentage of households with no vehicle available in the United States with a correlation coefficient (R) of 0.593 and weighted average of 9.4%, a difference of 31.8%.
No Vehicles in Household Correlation Summary
| Measurement | Welsh | Japanese |
| Minimum | 1.8% | 3.2% |
| Maximum | 26.1% | 36.9% |
| Range | 24.3% | 33.7% |
| Mean | 8.5% | 10.2% |
| Median | 6.5% | 8.9% |
| Interquartile 25% (IQ1) | 4.9% | 6.9% |
| Interquartile 75% (IQ3) | 10.0% | 12.6% |
| Interquartile Range (IQR) | 5.1% | 5.6% |
| Standard Deviation (Sample) | 6.1% | 5.9% |
| Standard Deviation (Population) | 6.1% | 5.8% |
Similar Demographics by No Vehicles in Household
Demographics Similar to Welsh by No Vehicles in Household
In terms of no vehicles in household, the demographic groups most similar to Welsh are Tongan (7.2%, a difference of 0.21%), European (7.1%, a difference of 0.56%), White/Caucasian (7.0%, a difference of 1.7%), Mexican (7.0%, a difference of 1.9%), and Scandinavian (7.0%, a difference of 2.0%).
| Demographics | Rating | Rank | No Vehicles in Household |
| Dutch | 100.0 /100 | #10 | Exceptional 6.8% |
| Czechs | 100.0 /100 | #11 | Exceptional 6.9% |
| Assyrians/Chaldeans/Syriacs | 100.0 /100 | #12 | Exceptional 7.0% |
| Scandinavians | 100.0 /100 | #13 | Exceptional 7.0% |
| Mexicans | 100.0 /100 | #14 | Exceptional 7.0% |
| Whites/Caucasians | 100.0 /100 | #15 | Exceptional 7.0% |
| Europeans | 100.0 /100 | #16 | Exceptional 7.1% |
| Welsh | 100.0 /100 | #17 | Exceptional 7.2% |
| Tongans | 100.0 /100 | #18 | Exceptional 7.2% |
| Arapaho | 100.0 /100 | #19 | Exceptional 7.4% |
| Ottawa | 100.0 /100 | #20 | Exceptional 7.4% |
| Nepalese | 100.0 /100 | #21 | Exceptional 7.4% |
| Irish | 100.0 /100 | #22 | Exceptional 7.4% |
| French | 100.0 /100 | #23 | Exceptional 7.4% |
| Immigrants | Iraq | 100.0 /100 | #24 | Exceptional 7.5% |
Demographics Similar to Japanese by No Vehicles in Household
In terms of no vehicles in household, the demographic groups most similar to Japanese are Navajo (9.4%, a difference of 0.070%), Serbian (9.4%, a difference of 0.13%), Chippewa (9.4%, a difference of 0.17%), Immigrants from Netherlands (9.4%, a difference of 0.56%), and Armenian (9.4%, a difference of 0.66%).
| Demographics | Rating | Rank | No Vehicles in Household |
| Maltese | 97.6 /100 | #109 | Exceptional 9.1% |
| Delaware | 97.2 /100 | #110 | Exceptional 9.2% |
| Immigrants | Kuwait | 95.1 /100 | #111 | Exceptional 9.4% |
| Armenians | 95.0 /100 | #112 | Exceptional 9.4% |
| Immigrants | Netherlands | 94.8 /100 | #113 | Exceptional 9.4% |
| Serbians | 94.3 /100 | #114 | Exceptional 9.4% |
| Navajo | 94.2 /100 | #115 | Exceptional 9.4% |
| Japanese | 94.1 /100 | #116 | Exceptional 9.4% |
| Chippewa | 93.8 /100 | #117 | Exceptional 9.4% |
| Greeks | 92.9 /100 | #118 | Exceptional 9.5% |
| Fijians | 92.7 /100 | #119 | Exceptional 9.5% |
| Immigrants | Thailand | 92.6 /100 | #120 | Exceptional 9.5% |
| Puget Sound Salish | 92.4 /100 | #121 | Exceptional 9.5% |
| Costa Ricans | 92.3 /100 | #122 | Exceptional 9.5% |
| Blackfeet | 91.4 /100 | #123 | Exceptional 9.6% |