Welsh vs Japanese Single Mother Households
COMPARE
Welsh
Japanese
Single Mother Households
Single Mother Households Comparison
Welsh
Japanese
5.9%
SINGLE MOTHER HOUSEHOLDS
92.8/ 100
METRIC RATING
126th/ 347
METRIC RANK
7.4%
SINGLE MOTHER HOUSEHOLDS
0.2/ 100
METRIC RATING
261st/ 347
METRIC RANK
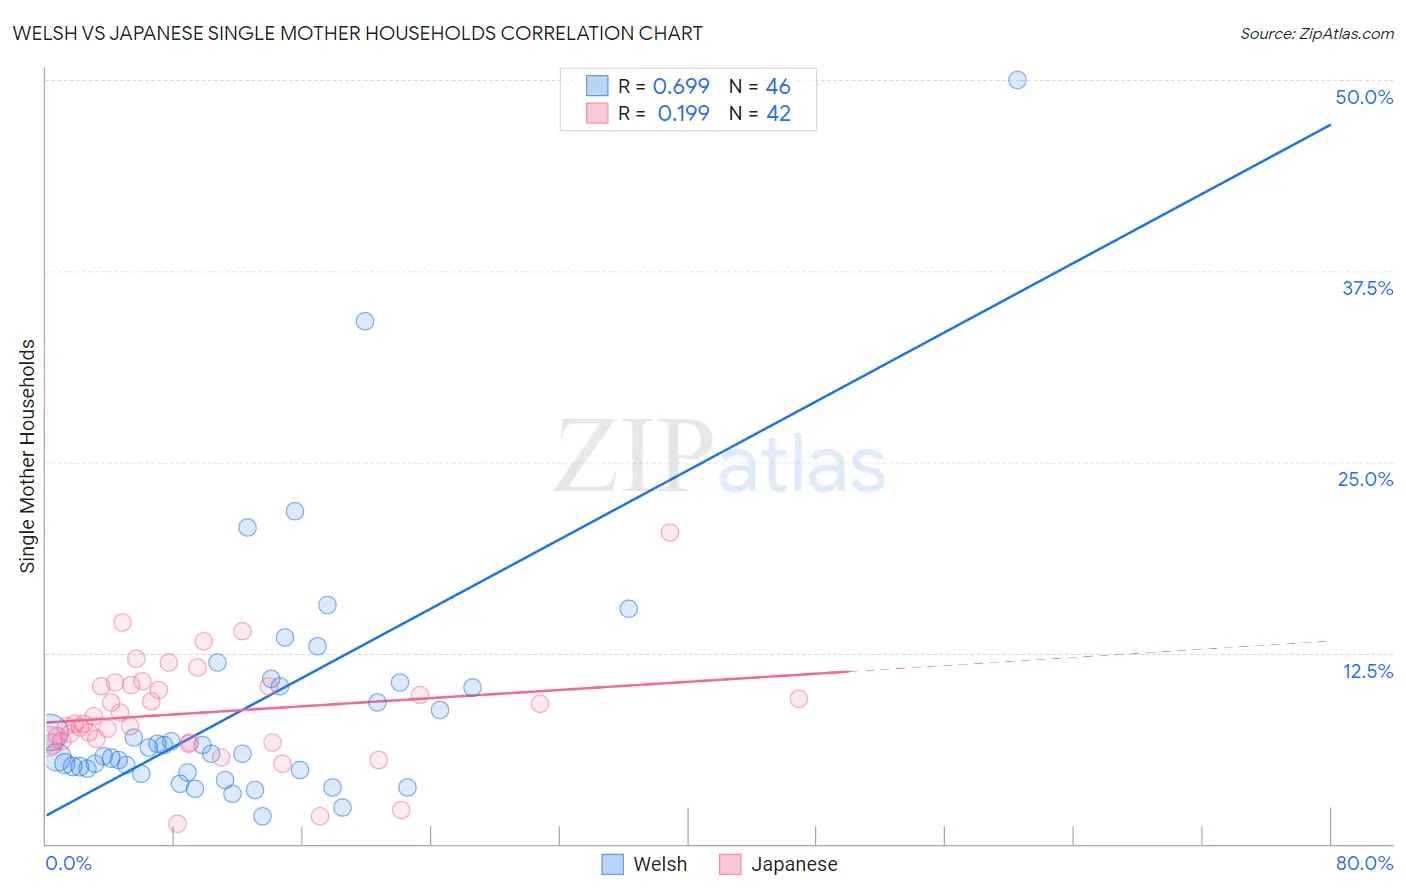
Welsh vs Japanese Single Mother Households Correlation Chart
The statistical analysis conducted on geographies consisting of 524,967,910 people shows a significant positive correlation between the proportion of Welsh and percentage of single mother households in the United States with a correlation coefficient (R) of 0.699 and weighted average of 5.9%. Similarly, the statistical analysis conducted on geographies consisting of 248,925,725 people shows a poor positive correlation between the proportion of Japanese and percentage of single mother households in the United States with a correlation coefficient (R) of 0.199 and weighted average of 7.4%, a difference of 26.2%.
Single Mother Households Correlation Summary
| Measurement | Welsh | Japanese |
| Minimum | 1.8% | 1.3% |
| Maximum | 50.0% | 20.4% |
| Range | 48.2% | 19.0% |
| Mean | 9.0% | 8.6% |
| Median | 5.9% | 7.8% |
| Interquartile 25% (IQ1) | 4.8% | 6.7% |
| Interquartile 75% (IQ3) | 10.3% | 10.3% |
| Interquartile Range (IQR) | 5.5% | 3.6% |
| Standard Deviation (Sample) | 8.6% | 3.4% |
| Standard Deviation (Population) | 8.5% | 3.4% |
Similar Demographics by Single Mother Households
Demographics Similar to Welsh by Single Mother Households
In terms of single mother households, the demographic groups most similar to Welsh are Slavic (5.9%, a difference of 0.020%), Immigrants from Argentina (5.9%, a difference of 0.18%), Lebanese (5.9%, a difference of 0.19%), Immigrants from Uzbekistan (5.9%, a difference of 0.25%), and Czechoslovakian (5.9%, a difference of 0.27%).
| Demographics | Rating | Rank | Single Mother Households |
| South Africans | 94.1 /100 | #119 | Exceptional 5.8% |
| Tongans | 93.7 /100 | #120 | Exceptional 5.8% |
| Argentineans | 93.7 /100 | #121 | Exceptional 5.8% |
| Belgians | 93.5 /100 | #122 | Exceptional 5.8% |
| Immigrants | Uzbekistan | 93.4 /100 | #123 | Exceptional 5.9% |
| Immigrants | Argentina | 93.2 /100 | #124 | Exceptional 5.9% |
| Slavs | 92.9 /100 | #125 | Exceptional 5.9% |
| Welsh | 92.8 /100 | #126 | Exceptional 5.9% |
| Lebanese | 92.4 /100 | #127 | Exceptional 5.9% |
| Czechoslovakians | 92.2 /100 | #128 | Exceptional 5.9% |
| Immigrants | Bolivia | 92.2 /100 | #129 | Exceptional 5.9% |
| Palestinians | 92.1 /100 | #130 | Exceptional 5.9% |
| Immigrants | Spain | 91.2 /100 | #131 | Exceptional 5.9% |
| Albanians | 91.1 /100 | #132 | Exceptional 5.9% |
| Egyptians | 90.7 /100 | #133 | Exceptional 5.9% |
Demographics Similar to Japanese by Single Mother Households
In terms of single mother households, the demographic groups most similar to Japanese are Immigrants from Zaire (7.4%, a difference of 0.020%), Immigrants from Yemen (7.4%, a difference of 0.060%), Pueblo (7.4%, a difference of 0.080%), Alaska Native (7.4%, a difference of 0.10%), and Seminole (7.4%, a difference of 0.15%).
| Demographics | Rating | Rank | Single Mother Households |
| Immigrants | Ecuador | 0.3 /100 | #254 | Tragic 7.3% |
| Mexican American Indians | 0.2 /100 | #255 | Tragic 7.4% |
| Seminole | 0.2 /100 | #256 | Tragic 7.4% |
| Alaska Natives | 0.2 /100 | #257 | Tragic 7.4% |
| Pueblo | 0.2 /100 | #258 | Tragic 7.4% |
| Immigrants | Yemen | 0.2 /100 | #259 | Tragic 7.4% |
| Immigrants | Zaire | 0.2 /100 | #260 | Tragic 7.4% |
| Japanese | 0.2 /100 | #261 | Tragic 7.4% |
| Immigrants | Somalia | 0.2 /100 | #262 | Tragic 7.4% |
| Immigrants | Nicaragua | 0.2 /100 | #263 | Tragic 7.4% |
| Yaqui | 0.1 /100 | #264 | Tragic 7.4% |
| Crow | 0.1 /100 | #265 | Tragic 7.4% |
| Nepalese | 0.1 /100 | #266 | Tragic 7.5% |
| Blackfeet | 0.1 /100 | #267 | Tragic 7.5% |
| Indonesians | 0.1 /100 | #268 | Tragic 7.5% |