Immigrants from Uzbekistan vs Japanese Male Poverty
COMPARE
Immigrants from Uzbekistan
Japanese
Male Poverty
Male Poverty Comparison
Immigrants from Uzbekistan
Japanese
12.2%
MALE POVERTY
2.6/ 100
METRIC RATING
215th/ 347
METRIC RANK
12.2%
MALE POVERTY
2.7/ 100
METRIC RATING
214th/ 347
METRIC RANK
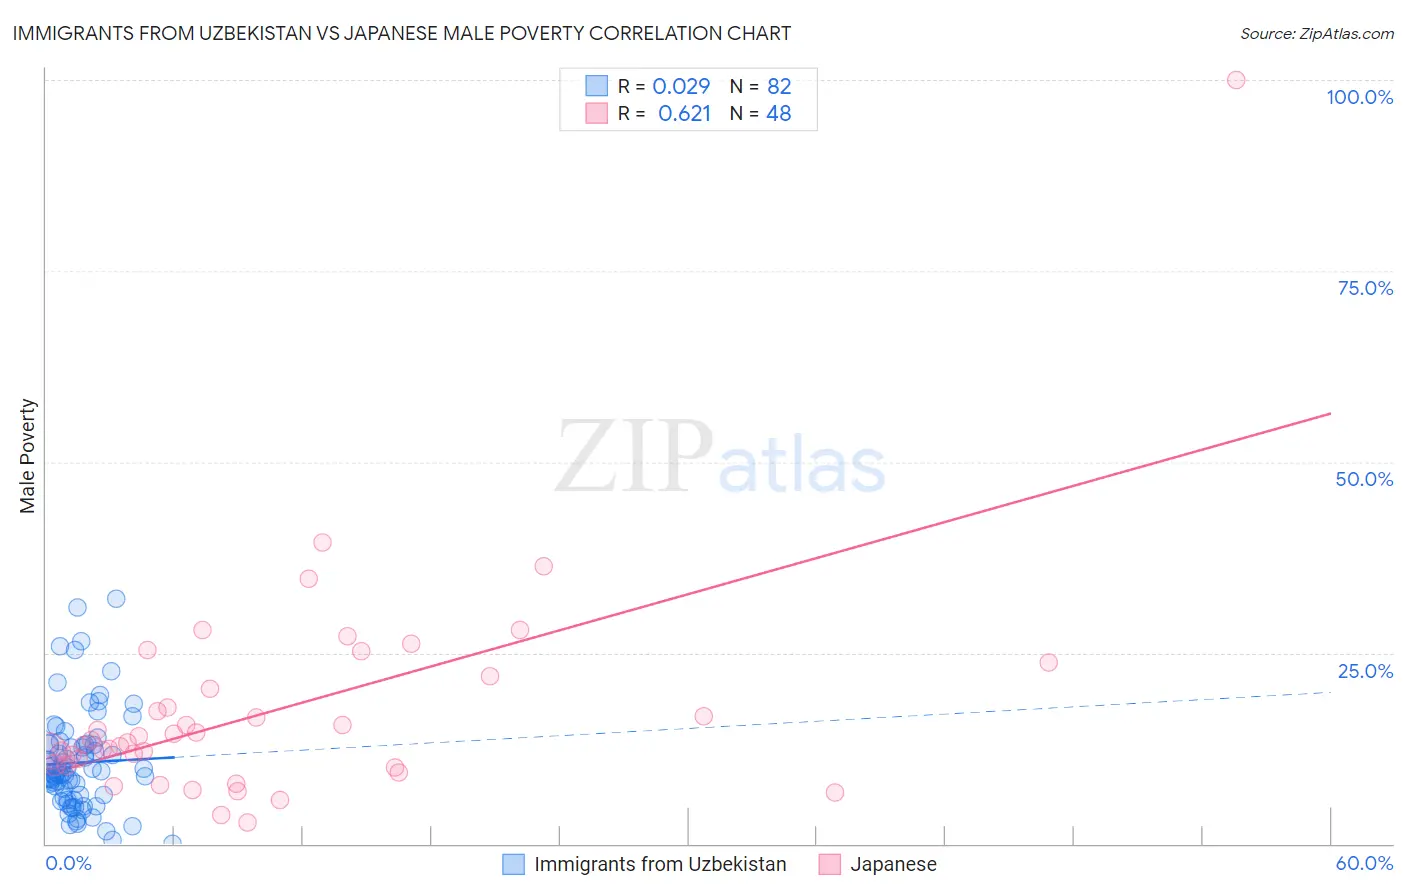
Immigrants from Uzbekistan vs Japanese Male Poverty Correlation Chart
The statistical analysis conducted on geographies consisting of 118,712,457 people shows no correlation between the proportion of Immigrants from Uzbekistan and poverty level among males in the United States with a correlation coefficient (R) of 0.029 and weighted average of 12.2%. Similarly, the statistical analysis conducted on geographies consisting of 249,058,138 people shows a significant positive correlation between the proportion of Japanese and poverty level among males in the United States with a correlation coefficient (R) of 0.621 and weighted average of 12.2%, a difference of 0.12%.
Male Poverty Correlation Summary
| Measurement | Immigrants from Uzbekistan | Japanese |
| Minimum | 0.066% | 2.8% |
| Maximum | 32.1% | 100.0% |
| Range | 32.0% | 97.2% |
| Mean | 10.6% | 17.5% |
| Median | 9.2% | 13.3% |
| Interquartile 25% (IQ1) | 6.1% | 10.3% |
| Interquartile 75% (IQ3) | 12.9% | 21.2% |
| Interquartile Range (IQR) | 6.9% | 10.9% |
| Standard Deviation (Sample) | 6.5% | 14.8% |
| Standard Deviation (Population) | 6.5% | 14.6% |
Demographics Similar to Immigrants from Uzbekistan and Japanese by Male Poverty
In terms of male poverty, the demographic groups most similar to Immigrants from Uzbekistan are Immigrants from Cambodia (12.2%, a difference of 0.080%), Immigrants from Thailand (12.2%, a difference of 0.090%), German Russian (12.2%, a difference of 0.11%), Bermudan (12.2%, a difference of 0.18%), and Immigrants from Eritrea (12.2%, a difference of 0.20%). Similarly, the demographic groups most similar to Japanese are Immigrants from Cambodia (12.2%, a difference of 0.20%), Immigrants from Thailand (12.2%, a difference of 0.21%), German Russian (12.2%, a difference of 0.23%), Bermudan (12.2%, a difference of 0.30%), and Nonimmigrants (12.1%, a difference of 0.32%).
| Demographics | Rating | Rank | Male Poverty |
| Immigrants | Uganda | 8.5 /100 | #204 | Tragic 11.8% |
| Panamanians | 6.2 /100 | #205 | Tragic 11.9% |
| Immigrants | Eastern Africa | 5.4 /100 | #206 | Tragic 12.0% |
| Malaysians | 5.2 /100 | #207 | Tragic 12.0% |
| Immigrants | Immigrants | 4.5 /100 | #208 | Tragic 12.0% |
| Immigrants | Azores | 4.3 /100 | #209 | Tragic 12.0% |
| Moroccans | 4.2 /100 | #210 | Tragic 12.0% |
| Immigrants | Panama | 4.0 /100 | #211 | Tragic 12.1% |
| Americans | 3.2 /100 | #212 | Tragic 12.1% |
| Immigrants | Nonimmigrants | 3.1 /100 | #213 | Tragic 12.1% |
| Japanese | 2.7 /100 | #214 | Tragic 12.2% |
| Immigrants | Uzbekistan | 2.6 /100 | #215 | Tragic 12.2% |
| Immigrants | Cambodia | 2.5 /100 | #216 | Tragic 12.2% |
| Immigrants | Thailand | 2.5 /100 | #217 | Tragic 12.2% |
| German Russians | 2.5 /100 | #218 | Tragic 12.2% |
| Bermudans | 2.4 /100 | #219 | Tragic 12.2% |
| Immigrants | Eritrea | 2.4 /100 | #220 | Tragic 12.2% |
| Ugandans | 2.2 /100 | #221 | Tragic 12.2% |
| Immigrants | Africa | 2.1 /100 | #222 | Tragic 12.2% |
| Immigrants | Micronesia | 2.1 /100 | #223 | Tragic 12.2% |
| Immigrants | Nigeria | 1.6 /100 | #224 | Tragic 12.3% |