Welsh vs Immigrants Householder Income Over 65 years
COMPARE
Welsh
Immigrants
Householder Income Over 65 years
Householder Income Over 65 years Comparison
Welsh
Immigrants
$60,666
HOUSEHOLDER INCOME OVER 65 YEARS
42.2/ 100
METRIC RATING
179th/ 347
METRIC RANK
$59,656
HOUSEHOLDER INCOME OVER 65 YEARS
20.2/ 100
METRIC RATING
199th/ 347
METRIC RANK
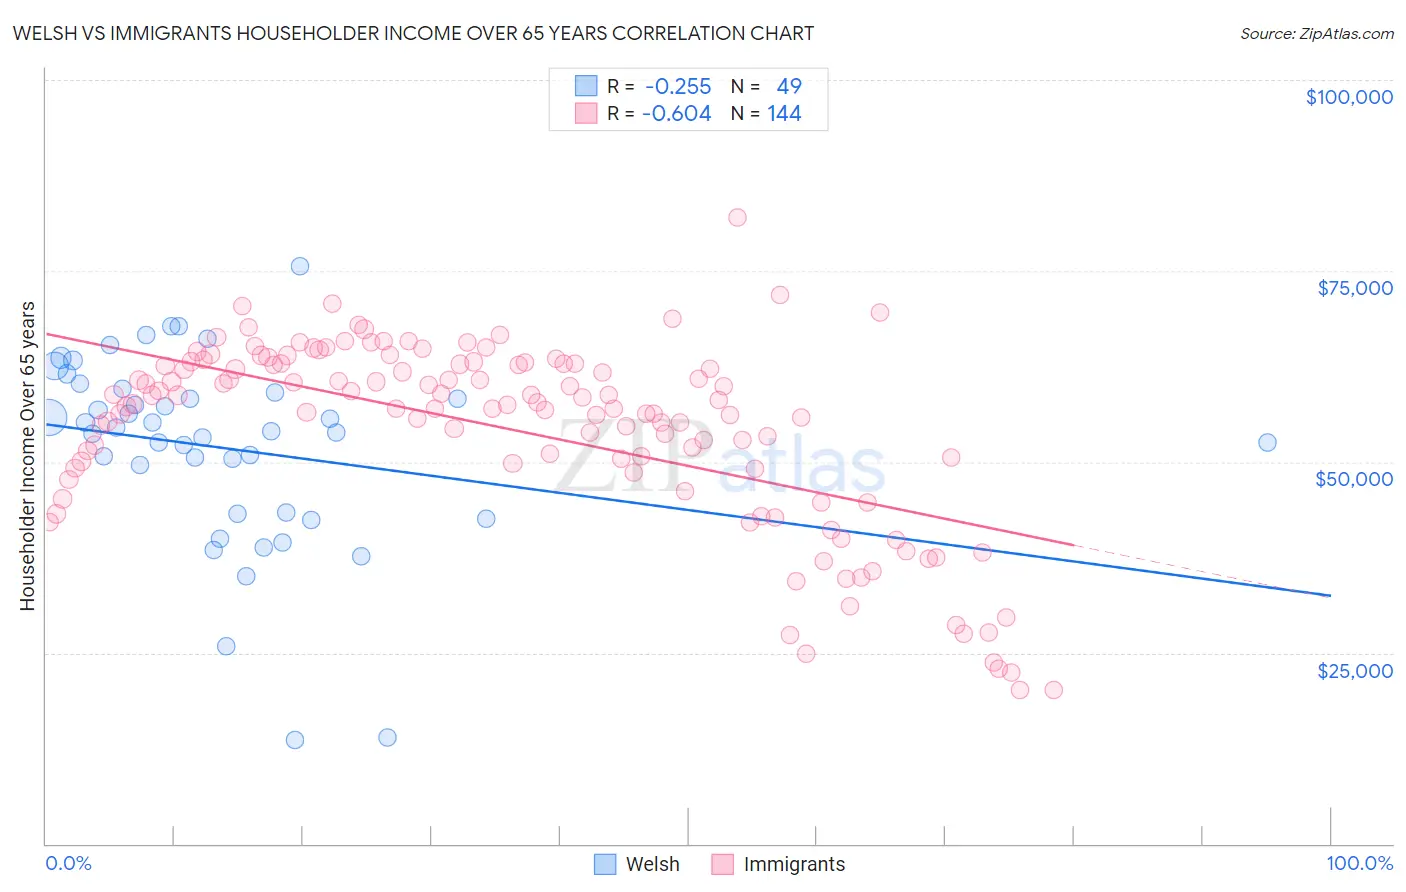
Welsh vs Immigrants Householder Income Over 65 years Correlation Chart
The statistical analysis conducted on geographies consisting of 525,240,397 people shows a weak negative correlation between the proportion of Welsh and household income with householder over the age of 65 in the United States with a correlation coefficient (R) of -0.255 and weighted average of $60,666. Similarly, the statistical analysis conducted on geographies consisting of 571,696,580 people shows a significant negative correlation between the proportion of Immigrants and household income with householder over the age of 65 in the United States with a correlation coefficient (R) of -0.604 and weighted average of $59,656, a difference of 1.7%.
Householder Income Over 65 years Correlation Summary
| Measurement | Welsh | Immigrants |
| Minimum | $13,664 | $20,075 |
| Maximum | $75,625 | $81,974 |
| Range | $61,961 | $61,899 |
| Mean | $51,794 | $54,149 |
| Median | $53,958 | $57,563 |
| Interquartile 25% (IQ1) | $43,354 | $49,162 |
| Interquartile 75% (IQ3) | $59,278 | $62,877 |
| Interquartile Range (IQR) | $15,924 | $13,715 |
| Standard Deviation (Sample) | $12,598 | $12,348 |
| Standard Deviation (Population) | $12,468 | $12,305 |
Demographics Similar to Welsh and Immigrants by Householder Income Over 65 years
In terms of householder income over 65 years, the demographic groups most similar to Welsh are Immigrants from Morocco ($60,647, a difference of 0.030%), Celtic ($60,608, a difference of 0.10%), Czechoslovakian ($60,581, a difference of 0.14%), Kenyan ($60,514, a difference of 0.25%), and Iraqi ($60,466, a difference of 0.33%). Similarly, the demographic groups most similar to Immigrants are Moroccan ($59,683, a difference of 0.050%), Immigrants from Kenya ($59,710, a difference of 0.090%), German ($59,730, a difference of 0.12%), Immigrants from Iraq ($59,824, a difference of 0.28%), and Immigrants from Africa ($59,837, a difference of 0.30%).
| Demographics | Rating | Rank | Householder Income Over 65 years |
| Welsh | 42.2 /100 | #179 | Average $60,666 |
| Immigrants | Morocco | 41.7 /100 | #180 | Average $60,647 |
| Celtics | 40.7 /100 | #181 | Average $60,608 |
| Czechoslovakians | 40.0 /100 | #182 | Average $60,581 |
| Kenyans | 38.4 /100 | #183 | Fair $60,514 |
| Iraqis | 37.2 /100 | #184 | Fair $60,466 |
| Albanians | 32.0 /100 | #185 | Fair $60,249 |
| Slovenes | 31.8 /100 | #186 | Fair $60,241 |
| Immigrants | Thailand | 31.3 /100 | #187 | Fair $60,217 |
| Immigrants | Eritrea | 28.6 /100 | #188 | Fair $60,096 |
| Ghanaians | 27.5 /100 | #189 | Fair $60,043 |
| Puget Sound Salish | 25.3 /100 | #190 | Fair $59,934 |
| Belgians | 24.9 /100 | #191 | Fair $59,915 |
| South Americans | 23.8 /100 | #192 | Fair $59,854 |
| Immigrants | Costa Rica | 23.6 /100 | #193 | Fair $59,848 |
| Immigrants | Africa | 23.4 /100 | #194 | Fair $59,837 |
| Immigrants | Iraq | 23.2 /100 | #195 | Fair $59,824 |
| Germans | 21.5 /100 | #196 | Fair $59,730 |
| Immigrants | Kenya | 21.1 /100 | #197 | Fair $59,710 |
| Moroccans | 20.7 /100 | #198 | Fair $59,683 |
| Immigrants | Immigrants | 20.2 /100 | #199 | Fair $59,656 |