Immigrants from Moldova vs Immigrants from Mexico Male Poverty
COMPARE
Immigrants from Moldova
Immigrants from Mexico
Male Poverty
Male Poverty Comparison
Immigrants from Moldova
Immigrants from Mexico
9.9%
MALE POVERTY
99.0/ 100
METRIC RATING
43rd/ 347
METRIC RANK
14.0%
MALE POVERTY
0.0/ 100
METRIC RATING
300th/ 347
METRIC RANK
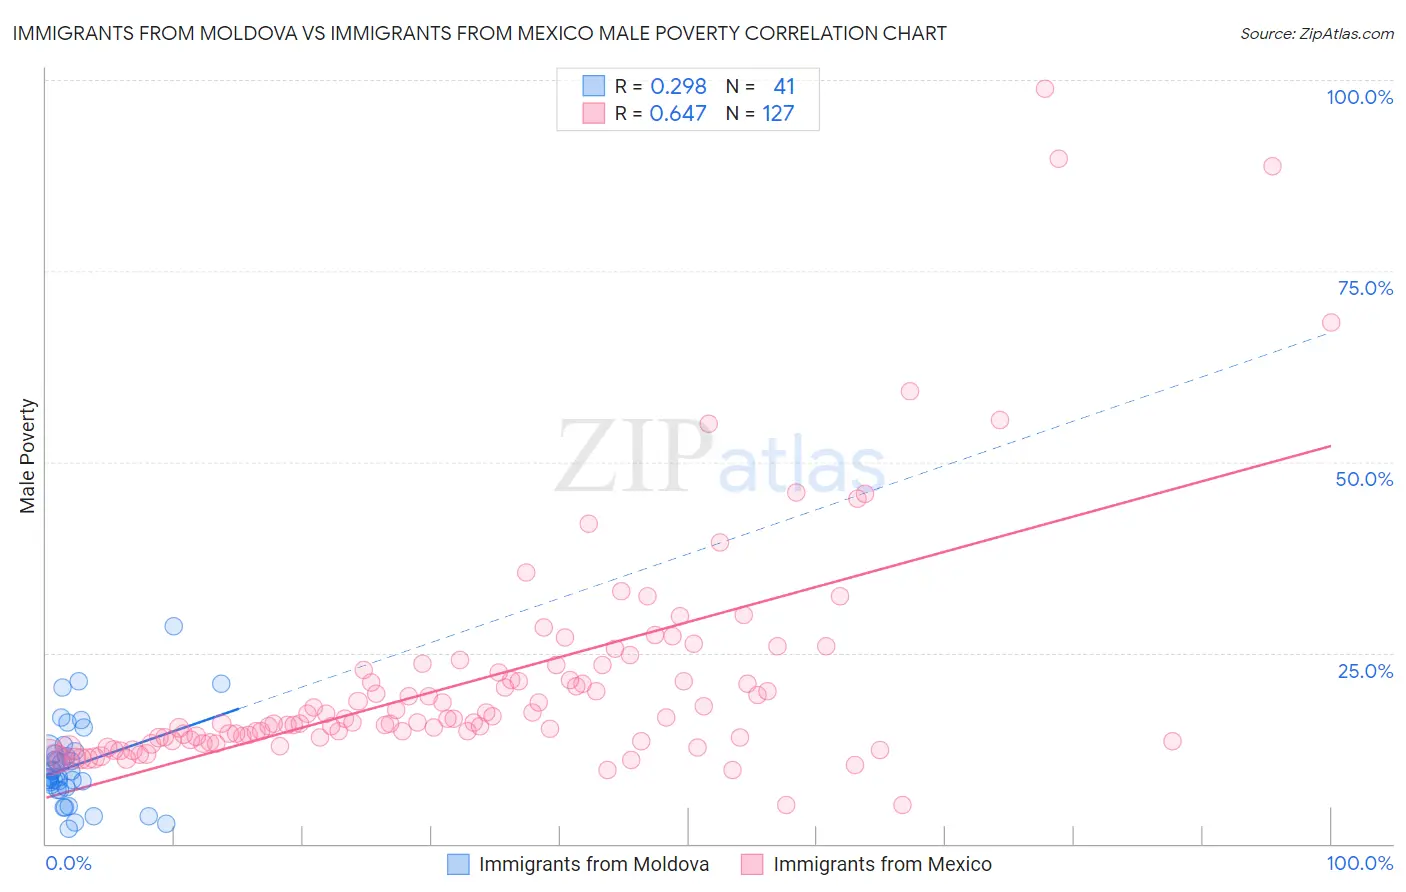
Immigrants from Moldova vs Immigrants from Mexico Male Poverty Correlation Chart
The statistical analysis conducted on geographies consisting of 124,352,223 people shows a weak positive correlation between the proportion of Immigrants from Moldova and poverty level among males in the United States with a correlation coefficient (R) of 0.298 and weighted average of 9.9%. Similarly, the statistical analysis conducted on geographies consisting of 513,064,381 people shows a significant positive correlation between the proportion of Immigrants from Mexico and poverty level among males in the United States with a correlation coefficient (R) of 0.647 and weighted average of 14.0%, a difference of 41.4%.
Male Poverty Correlation Summary
| Measurement | Immigrants from Moldova | Immigrants from Mexico |
| Minimum | 1.9% | 5.0% |
| Maximum | 28.4% | 98.8% |
| Range | 26.5% | 93.8% |
| Mean | 10.3% | 21.4% |
| Median | 8.8% | 15.9% |
| Interquartile 25% (IQ1) | 7.2% | 13.5% |
| Interquartile 75% (IQ3) | 12.2% | 22.7% |
| Interquartile Range (IQR) | 5.0% | 9.2% |
| Standard Deviation (Sample) | 5.6% | 15.3% |
| Standard Deviation (Population) | 5.5% | 15.2% |
Similar Demographics by Male Poverty
Demographics Similar to Immigrants from Moldova by Male Poverty
In terms of male poverty, the demographic groups most similar to Immigrants from Moldova are Immigrants from Romania (9.9%, a difference of 0.22%), Immigrants from Iran (9.9%, a difference of 0.26%), Immigrants from Serbia (10.0%, a difference of 0.40%), Turkish (10.0%, a difference of 0.42%), and Korean (9.9%, a difference of 0.50%).
| Demographics | Rating | Rank | Male Poverty |
| Czechs | 99.4 /100 | #36 | Exceptional 9.8% |
| Immigrants | Greece | 99.3 /100 | #37 | Exceptional 9.8% |
| Immigrants | Pakistan | 99.2 /100 | #38 | Exceptional 9.9% |
| Russians | 99.2 /100 | #39 | Exceptional 9.9% |
| Cypriots | 99.2 /100 | #40 | Exceptional 9.9% |
| Koreans | 99.2 /100 | #41 | Exceptional 9.9% |
| Immigrants | Iran | 99.1 /100 | #42 | Exceptional 9.9% |
| Immigrants | Moldova | 99.0 /100 | #43 | Exceptional 9.9% |
| Immigrants | Romania | 98.9 /100 | #44 | Exceptional 9.9% |
| Immigrants | Serbia | 98.9 /100 | #45 | Exceptional 10.0% |
| Turks | 98.9 /100 | #46 | Exceptional 10.0% |
| Immigrants | Singapore | 98.8 /100 | #47 | Exceptional 10.0% |
| Immigrants | Japan | 98.8 /100 | #48 | Exceptional 10.0% |
| Slovenes | 98.8 /100 | #49 | Exceptional 10.0% |
| Immigrants | Philippines | 98.7 /100 | #50 | Exceptional 10.0% |
Demographics Similar to Immigrants from Mexico by Male Poverty
In terms of male poverty, the demographic groups most similar to Immigrants from Mexico are Immigrants from Senegal (14.0%, a difference of 0.070%), Immigrants from Guatemala (14.0%, a difference of 0.12%), Immigrants from Caribbean (14.0%, a difference of 0.13%), Bahamian (14.1%, a difference of 0.17%), and Blackfeet (14.0%, a difference of 0.22%).
| Demographics | Rating | Rank | Male Poverty |
| Immigrants | Belize | 0.0 /100 | #293 | Tragic 13.8% |
| Hispanics or Latinos | 0.0 /100 | #294 | Tragic 13.9% |
| Immigrants | Central America | 0.0 /100 | #295 | Tragic 13.9% |
| Cajuns | 0.0 /100 | #296 | Tragic 13.9% |
| Inupiat | 0.0 /100 | #297 | Tragic 14.0% |
| Blackfeet | 0.0 /100 | #298 | Tragic 14.0% |
| Immigrants | Guatemala | 0.0 /100 | #299 | Tragic 14.0% |
| Immigrants | Mexico | 0.0 /100 | #300 | Tragic 14.0% |
| Immigrants | Senegal | 0.0 /100 | #301 | Tragic 14.0% |
| Immigrants | Caribbean | 0.0 /100 | #302 | Tragic 14.0% |
| Bahamians | 0.0 /100 | #303 | Tragic 14.1% |
| Senegalese | 0.0 /100 | #304 | Tragic 14.1% |
| Immigrants | Bangladesh | 0.0 /100 | #305 | Tragic 14.1% |
| Creek | 0.0 /100 | #306 | Tragic 14.1% |
| Dutch West Indians | 0.0 /100 | #307 | Tragic 14.2% |