Eastern European vs Immigrants from Mexico Male Poverty
COMPARE
Eastern European
Immigrants from Mexico
Male Poverty
Male Poverty Comparison
Eastern Europeans
Immigrants from Mexico
9.6%
MALE POVERTY
99.6/ 100
METRIC RATING
25th/ 347
METRIC RANK
14.0%
MALE POVERTY
0.0/ 100
METRIC RATING
300th/ 347
METRIC RANK
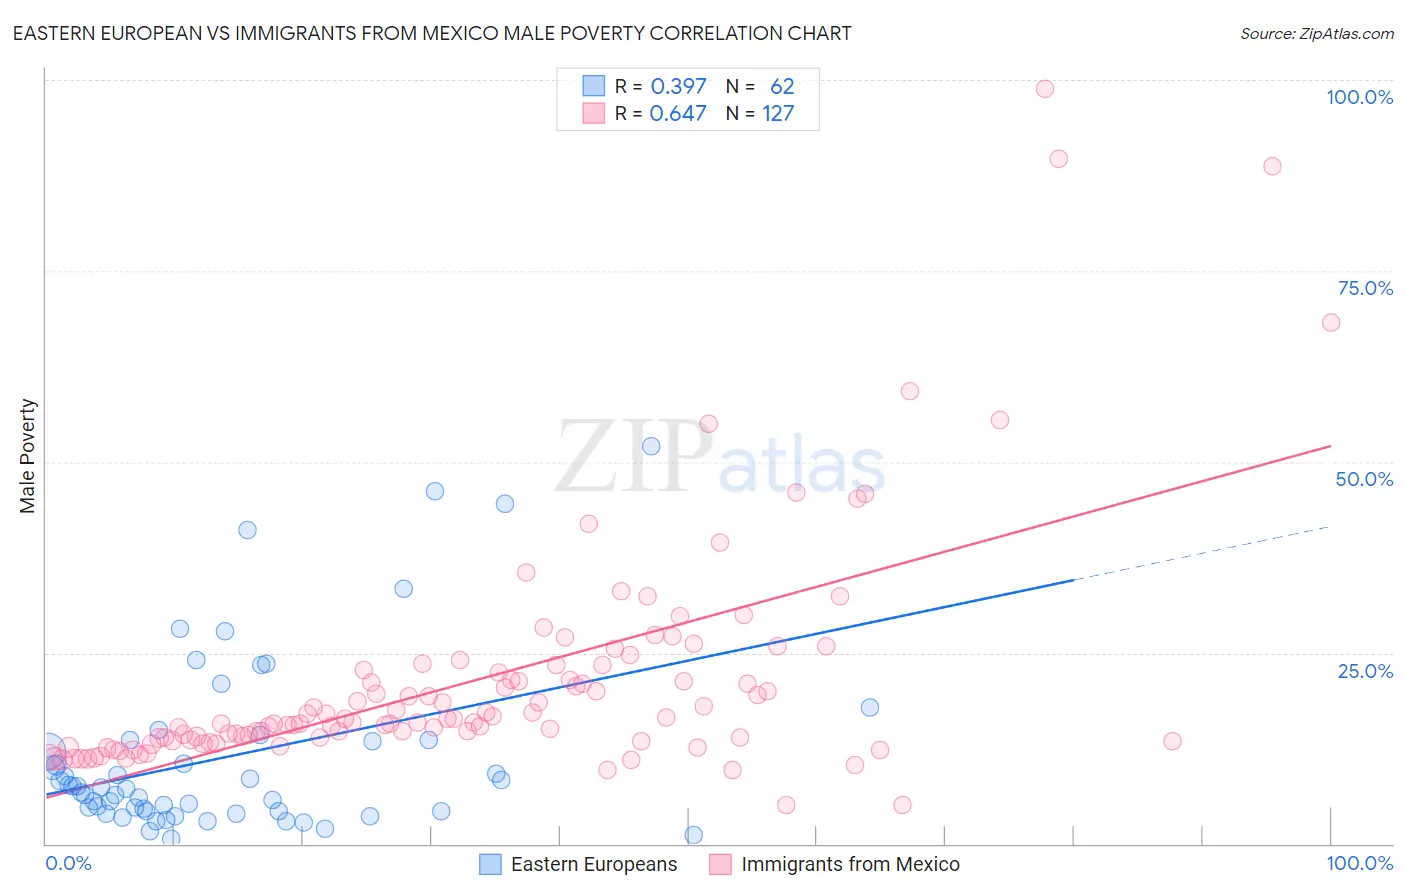
Eastern European vs Immigrants from Mexico Male Poverty Correlation Chart
The statistical analysis conducted on geographies consisting of 460,627,341 people shows a mild positive correlation between the proportion of Eastern Europeans and poverty level among males in the United States with a correlation coefficient (R) of 0.397 and weighted average of 9.6%. Similarly, the statistical analysis conducted on geographies consisting of 513,064,381 people shows a significant positive correlation between the proportion of Immigrants from Mexico and poverty level among males in the United States with a correlation coefficient (R) of 0.647 and weighted average of 14.0%, a difference of 45.6%.
Male Poverty Correlation Summary
| Measurement | Eastern European | Immigrants from Mexico |
| Minimum | 0.67% | 5.0% |
| Maximum | 52.0% | 98.8% |
| Range | 51.3% | 93.8% |
| Mean | 11.4% | 21.4% |
| Median | 7.3% | 15.9% |
| Interquartile 25% (IQ1) | 4.3% | 13.5% |
| Interquartile 75% (IQ3) | 13.5% | 22.7% |
| Interquartile Range (IQR) | 9.3% | 9.2% |
| Standard Deviation (Sample) | 11.6% | 15.3% |
| Standard Deviation (Population) | 11.5% | 15.2% |
Similar Demographics by Male Poverty
Demographics Similar to Eastern Europeans by Male Poverty
In terms of male poverty, the demographic groups most similar to Eastern Europeans are Swedish (9.6%, a difference of 0.14%), Italian (9.6%, a difference of 0.22%), Croatian (9.6%, a difference of 0.23%), Burmese (9.7%, a difference of 0.44%), and Immigrants from Scotland (9.6%, a difference of 0.48%).
| Demographics | Rating | Rank | Male Poverty |
| Lithuanians | 99.8 /100 | #18 | Exceptional 9.5% |
| Immigrants | Hong Kong | 99.7 /100 | #19 | Exceptional 9.6% |
| Latvians | 99.7 /100 | #20 | Exceptional 9.6% |
| Immigrants | Scotland | 99.7 /100 | #21 | Exceptional 9.6% |
| Croatians | 99.7 /100 | #22 | Exceptional 9.6% |
| Italians | 99.7 /100 | #23 | Exceptional 9.6% |
| Swedes | 99.7 /100 | #24 | Exceptional 9.6% |
| Eastern Europeans | 99.6 /100 | #25 | Exceptional 9.6% |
| Burmese | 99.6 /100 | #26 | Exceptional 9.7% |
| Danes | 99.6 /100 | #27 | Exceptional 9.7% |
| Immigrants | Korea | 99.6 /100 | #28 | Exceptional 9.7% |
| Greeks | 99.6 /100 | #29 | Exceptional 9.7% |
| Poles | 99.5 /100 | #30 | Exceptional 9.7% |
| Tongans | 99.5 /100 | #31 | Exceptional 9.7% |
| Macedonians | 99.5 /100 | #32 | Exceptional 9.7% |
Demographics Similar to Immigrants from Mexico by Male Poverty
In terms of male poverty, the demographic groups most similar to Immigrants from Mexico are Immigrants from Senegal (14.0%, a difference of 0.070%), Immigrants from Guatemala (14.0%, a difference of 0.12%), Immigrants from Caribbean (14.0%, a difference of 0.13%), Bahamian (14.1%, a difference of 0.17%), and Blackfeet (14.0%, a difference of 0.22%).
| Demographics | Rating | Rank | Male Poverty |
| Immigrants | Belize | 0.0 /100 | #293 | Tragic 13.8% |
| Hispanics or Latinos | 0.0 /100 | #294 | Tragic 13.9% |
| Immigrants | Central America | 0.0 /100 | #295 | Tragic 13.9% |
| Cajuns | 0.0 /100 | #296 | Tragic 13.9% |
| Inupiat | 0.0 /100 | #297 | Tragic 14.0% |
| Blackfeet | 0.0 /100 | #298 | Tragic 14.0% |
| Immigrants | Guatemala | 0.0 /100 | #299 | Tragic 14.0% |
| Immigrants | Mexico | 0.0 /100 | #300 | Tragic 14.0% |
| Immigrants | Senegal | 0.0 /100 | #301 | Tragic 14.0% |
| Immigrants | Caribbean | 0.0 /100 | #302 | Tragic 14.0% |
| Bahamians | 0.0 /100 | #303 | Tragic 14.1% |
| Senegalese | 0.0 /100 | #304 | Tragic 14.1% |
| Immigrants | Bangladesh | 0.0 /100 | #305 | Tragic 14.1% |
| Creek | 0.0 /100 | #306 | Tragic 14.1% |
| Dutch West Indians | 0.0 /100 | #307 | Tragic 14.2% |