Welsh vs Immigrants from Kuwait Receiving Food Stamps
COMPARE
Welsh
Immigrants from Kuwait
Receiving Food Stamps
Receiving Food Stamps Comparison
Welsh
Immigrants from Kuwait
10.3%
RECEIVING FOOD STAMPS
97.3/ 100
METRIC RATING
96th/ 347
METRIC RANK
10.0%
RECEIVING FOOD STAMPS
98.4/ 100
METRIC RATING
88th/ 347
METRIC RANK
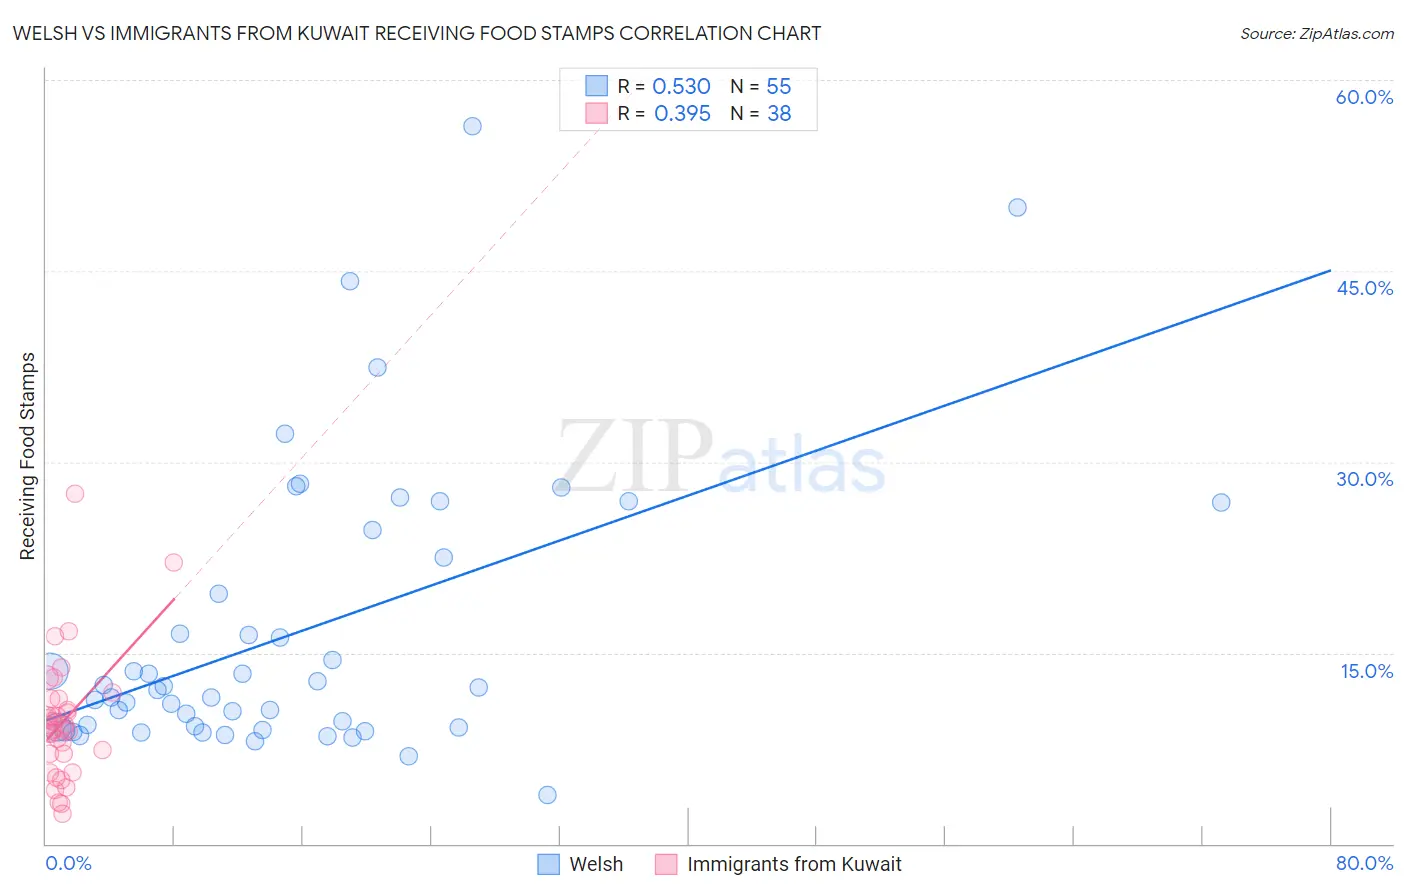
Welsh vs Immigrants from Kuwait Receiving Food Stamps Correlation Chart
The statistical analysis conducted on geographies consisting of 526,059,303 people shows a substantial positive correlation between the proportion of Welsh and percentage of population receiving government assistance and/or food stamps in the United States with a correlation coefficient (R) of 0.530 and weighted average of 10.3%. Similarly, the statistical analysis conducted on geographies consisting of 136,818,159 people shows a mild positive correlation between the proportion of Immigrants from Kuwait and percentage of population receiving government assistance and/or food stamps in the United States with a correlation coefficient (R) of 0.395 and weighted average of 10.0%, a difference of 2.1%.
Receiving Food Stamps Correlation Summary
| Measurement | Welsh | Immigrants from Kuwait |
| Minimum | 3.8% | 2.4% |
| Maximum | 56.4% | 27.5% |
| Range | 52.6% | 25.1% |
| Mean | 16.5% | 9.7% |
| Median | 12.1% | 9.1% |
| Interquartile 25% (IQ1) | 9.1% | 7.1% |
| Interquartile 75% (IQ3) | 22.5% | 11.4% |
| Interquartile Range (IQR) | 13.4% | 4.3% |
| Standard Deviation (Sample) | 11.2% | 5.0% |
| Standard Deviation (Population) | 11.1% | 4.9% |
Demographics Similar to Welsh and Immigrants from Kuwait by Receiving Food Stamps
In terms of receiving food stamps, the demographic groups most similar to Welsh are Basque (10.3%, a difference of 0.050%), Immigrants from Greece (10.3%, a difference of 0.080%), Czechoslovakian (10.3%, a difference of 0.26%), Immigrants from Egypt (10.3%, a difference of 0.31%), and Serbian (10.3%, a difference of 0.49%). Similarly, the demographic groups most similar to Immigrants from Kuwait are Egyptian (10.0%, a difference of 0.060%), Immigrants from Norway (10.0%, a difference of 0.090%), Immigrants from Romania (10.0%, a difference of 0.19%), Immigrants from France (10.1%, a difference of 0.25%), and Immigrants from Israel (10.0%, a difference of 0.36%).
| Demographics | Rating | Rank | Receiving Food Stamps |
| Austrians | 98.6 /100 | #82 | Exceptional 10.0% |
| Dutch | 98.6 /100 | #83 | Exceptional 10.0% |
| Immigrants | Israel | 98.5 /100 | #84 | Exceptional 10.0% |
| Immigrants | Romania | 98.5 /100 | #85 | Exceptional 10.0% |
| Immigrants | Norway | 98.4 /100 | #86 | Exceptional 10.0% |
| Egyptians | 98.4 /100 | #87 | Exceptional 10.0% |
| Immigrants | Kuwait | 98.4 /100 | #88 | Exceptional 10.0% |
| Immigrants | France | 98.3 /100 | #89 | Exceptional 10.1% |
| Finns | 97.9 /100 | #90 | Exceptional 10.2% |
| Jordanians | 97.9 /100 | #91 | Exceptional 10.2% |
| Irish | 97.9 /100 | #92 | Exceptional 10.2% |
| Belgians | 97.7 /100 | #93 | Exceptional 10.2% |
| Immigrants | Greece | 97.4 /100 | #94 | Exceptional 10.3% |
| Basques | 97.4 /100 | #95 | Exceptional 10.3% |
| Welsh | 97.3 /100 | #96 | Exceptional 10.3% |
| Czechoslovakians | 97.2 /100 | #97 | Exceptional 10.3% |
| Immigrants | Egypt | 97.1 /100 | #98 | Exceptional 10.3% |
| Serbians | 97.0 /100 | #99 | Exceptional 10.3% |
| Immigrants | Western Europe | 96.9 /100 | #100 | Exceptional 10.3% |
| Palestinians | 96.9 /100 | #101 | Exceptional 10.3% |
| Immigrants | Europe | 96.8 /100 | #102 | Exceptional 10.3% |