Immigrants from Cuba vs Immigrants from Brazil Male Poverty

COMPARE

Immigrants from Cuba
Race
Ancestry
AfghanAfricanAlaska NativeAlaskan AthabascanAlbanianAleutAlsatianAmericanApacheArabArapahoArgentineanArmenianAssyrian/Chaldean/SyriacAustralianAustrianBahamianBangladeshiBarbadianBasqueBelgianBelizeanBermudanBhutaneseBlackfeetBolivianBrazilianBritishBritish West IndianBulgarianBurmeseCajunCambodianCanadianCape VerdeanCarpatho RusynCelticCentral AmericanCentral American IndianCherokeeCheyenneChickasawChileanChineseChippewaChoctawColombianColvilleComancheCosta RicanCreeCreekCroatianCrowCubanCypriotCzechCzechoslovakianDanishDelawareDominicanDutchDutch West IndianEastern EuropeanEcuadorianEgyptianEnglishEstonianEthiopianEuropeanFijianFilipinoFinnishFrenchFrench American IndianFrench CanadianGermanGerman RussianGhanaianGreekGuamanian/ChamorroGuatemalanGuyaneseHaitianHmongHonduranHopiHoumaHungarianIcelanderIndian (Asian)IndonesianInupiatIranianIraqiIrishIroquoisIsraeliItalianJamaicanJapaneseJordanianKenyanKiowaKoreanLaotianLatvianLebaneseLiberianLithuanianLumbeeLuxembourgerMacedonianMalaysianMalteseMarshalleseMenomineeMexicanMexican American IndianMongolianMoroccanNative HawaiianNavajoNepaleseNew ZealanderNicaraguanNigerianNorthern EuropeanNorwegianOkinawanOsageOttawaPaiutePakistaniPalestinianPanamanianParaguayanPennsylvania GermanPeruvianPimaPolishPortuguesePotawatomiPuebloPuerto RicanPuget Sound SalishRomanianRussianSalvadoranSamoanScandinavianScotch-IrishScottishSeminoleSenegaleseSerbianShoshoneSierra LeoneanSiouxSlavicSlovakSloveneSomaliSouth AfricanSouth AmericanSouth American IndianSoviet UnionSpaniardSpanishSpanish AmericanSpanish American IndianSri LankanSubsaharan AfricanSudaneseSwedishSwissSyrianTaiwaneseThaiTlingit-HaidaTohono O'OdhamTonganTrinidadian and TobagonianTsimshianTurkishU.S. Virgin IslanderUgandanUkrainianUruguayanUteVenezuelanVietnameseWelshWest IndianYakamaYaquiYugoslavianYumanYup'ikZimbabwean
Immigration
NonimmigrantsImmigrantsAfghanistanAfricaAlbaniaArgentinaArmeniaAsiaAustraliaAustriaBahamasBangladeshBarbadosBelarusBelgiumBelizeBoliviaBosnia and HerzegovinaBulgariaBurma/MyanmarCabo VerdeCambodiaCameroonCanadaCaribbeanCentral AmericaChileChinaColombiaCongoCosta RicaCroatiaCubaCzechoslovakiaDenmarkDominicaDominican RepublicEastern AfricaEastern AsiaEastern EuropeEcuadorEgyptEl SalvadorEnglandEritreaEthiopiaEuropeFijiFranceGermanyGhanaGreeceGrenadaGuatemalaGuyanaHaitiHondurasHong KongHungaryIndiaIndonesiaIranIraqIrelandIsraelItalyJamaicaJapanJordanKazakhstanKenyaKoreaKuwaitLaosLatin AmericaLatviaLebanonLiberiaLithuaniaMalaysiaMexicoMicronesiaMiddle AfricaMoldovaMoroccoNepalNetherlandsNicaraguaNigeriaNorth AmericaNorth MacedoniaNorthern AfricaNorthern EuropeNorwayOceaniaPakistanPanamaPeruPhilippinesPolandPortugalRomaniaRussiaSaudi ArabiaScotlandSenegalSerbiaSierra LeoneSingaporeSomaliaSouth AfricaSouth AmericaSouth Central AsiaSouth Eastern AsiaSouthern EuropeSpainSri LankaSt. Vincent and the GrenadinesSudanSwedenSwitzerlandSyriaTaiwanThailandTrinidad and TobagoTurkeyUgandaUkraineUruguayUzbekistanVenezuelaVietnamWest IndiesWestern AfricaWestern AsiaWestern EuropeYemenZaireZimbabweAzores
Immigrants from Brazil
Race
Ancestry
AfghanAfricanAlaska NativeAlaskan AthabascanAlbanianAleutAlsatianAmericanApacheArabArapahoArgentineanArmenianAssyrian/Chaldean/SyriacAustralianAustrianBahamianBangladeshiBarbadianBasqueBelgianBelizeanBermudanBhutaneseBlackfeetBolivianBrazilianBritishBritish West IndianBulgarianBurmeseCajunCambodianCanadianCape VerdeanCarpatho RusynCelticCentral AmericanCentral American IndianCherokeeCheyenneChickasawChileanChineseChippewaChoctawColombianColvilleComancheCosta RicanCreeCreekCroatianCrowCubanCypriotCzechCzechoslovakianDanishDelawareDominicanDutchDutch West IndianEastern EuropeanEcuadorianEgyptianEnglishEstonianEthiopianEuropeanFijianFilipinoFinnishFrenchFrench American IndianFrench CanadianGermanGerman RussianGhanaianGreekGuamanian/ChamorroGuatemalanGuyaneseHaitianHmongHonduranHopiHoumaHungarianIcelanderIndian (Asian)IndonesianInupiatIranianIraqiIrishIroquoisIsraeliItalianJamaicanJapaneseJordanianKenyanKiowaKoreanLaotianLatvianLebaneseLiberianLithuanianLumbeeLuxembourgerMacedonianMalaysianMalteseMarshalleseMenomineeMexicanMexican American IndianMongolianMoroccanNative HawaiianNavajoNepaleseNew ZealanderNicaraguanNigerianNorthern EuropeanNorwegianOkinawanOsageOttawaPaiutePakistaniPalestinianPanamanianParaguayanPennsylvania GermanPeruvianPimaPolishPortuguesePotawatomiPuebloPuerto RicanPuget Sound SalishRomanianRussianSalvadoranSamoanScandinavianScotch-IrishScottishSeminoleSenegaleseSerbianShoshoneSierra LeoneanSiouxSlavicSlovakSloveneSomaliSouth AfricanSouth AmericanSouth American IndianSoviet UnionSpaniardSpanishSpanish AmericanSpanish American IndianSri LankanSubsaharan AfricanSudaneseSwedishSwissSyrianTaiwaneseThaiTlingit-HaidaTohono O'OdhamTonganTrinidadian and TobagonianTsimshianTurkishU.S. Virgin IslanderUgandanUkrainianUruguayanUteVenezuelanVietnameseWelshWest IndianYakamaYaquiYugoslavianYumanYup'ikZimbabwean
Immigration
NonimmigrantsImmigrantsAfghanistanAfricaAlbaniaArgentinaArmeniaAsiaAustraliaAustriaBahamasBangladeshBarbadosBelarusBelgiumBelizeBoliviaBosnia and HerzegovinaBrazilBulgariaBurma/MyanmarCabo VerdeCambodiaCameroonCanadaCaribbeanCentral AmericaChileChinaColombiaCongoCosta RicaCroatiaCzechoslovakiaDenmarkDominicaDominican RepublicEastern AfricaEastern AsiaEastern EuropeEcuadorEgyptEl SalvadorEnglandEritreaEthiopiaEuropeFijiFranceGermanyGhanaGreeceGrenadaGuatemalaGuyanaHaitiHondurasHong KongHungaryIndiaIndonesiaIranIraqIrelandIsraelItalyJamaicaJapanJordanKazakhstanKenyaKoreaKuwaitLaosLatin AmericaLatviaLebanonLiberiaLithuaniaMalaysiaMexicoMicronesiaMiddle AfricaMoldovaMoroccoNepalNetherlandsNicaraguaNigeriaNorth AmericaNorth MacedoniaNorthern AfricaNorthern EuropeNorwayOceaniaPakistanPanamaPeruPhilippinesPolandPortugalRomaniaRussiaSaudi ArabiaScotlandSenegalSerbiaSierra LeoneSingaporeSomaliaSouth AfricaSouth AmericaSouth Central AsiaSouth Eastern AsiaSouthern EuropeSpainSri LankaSt. Vincent and the GrenadinesSudanSwedenSwitzerlandSyriaTaiwanThailandTrinidad and TobagoTurkeyUgandaUkraineUruguayUzbekistanVenezuelaVietnamWest IndiesWestern AfricaWestern AsiaWestern EuropeYemenZaireZimbabweAzores
Male Poverty
Income
Poverty
Unemployment
Labor Participation
Family Structure
Vehicle Availability
Education Level
Disability

Male Poverty Comparison

Immigrants from Cuba

Immigrants from Brazil

Tragic
Excellent
12.9%
MALE POVERTY
0.2/ 100
METRIC RATING
251st/ 347
METRIC RANK
10.6%
MALE POVERTY
89.0/ 100
METRIC RATING
114th/ 347
METRIC RANK

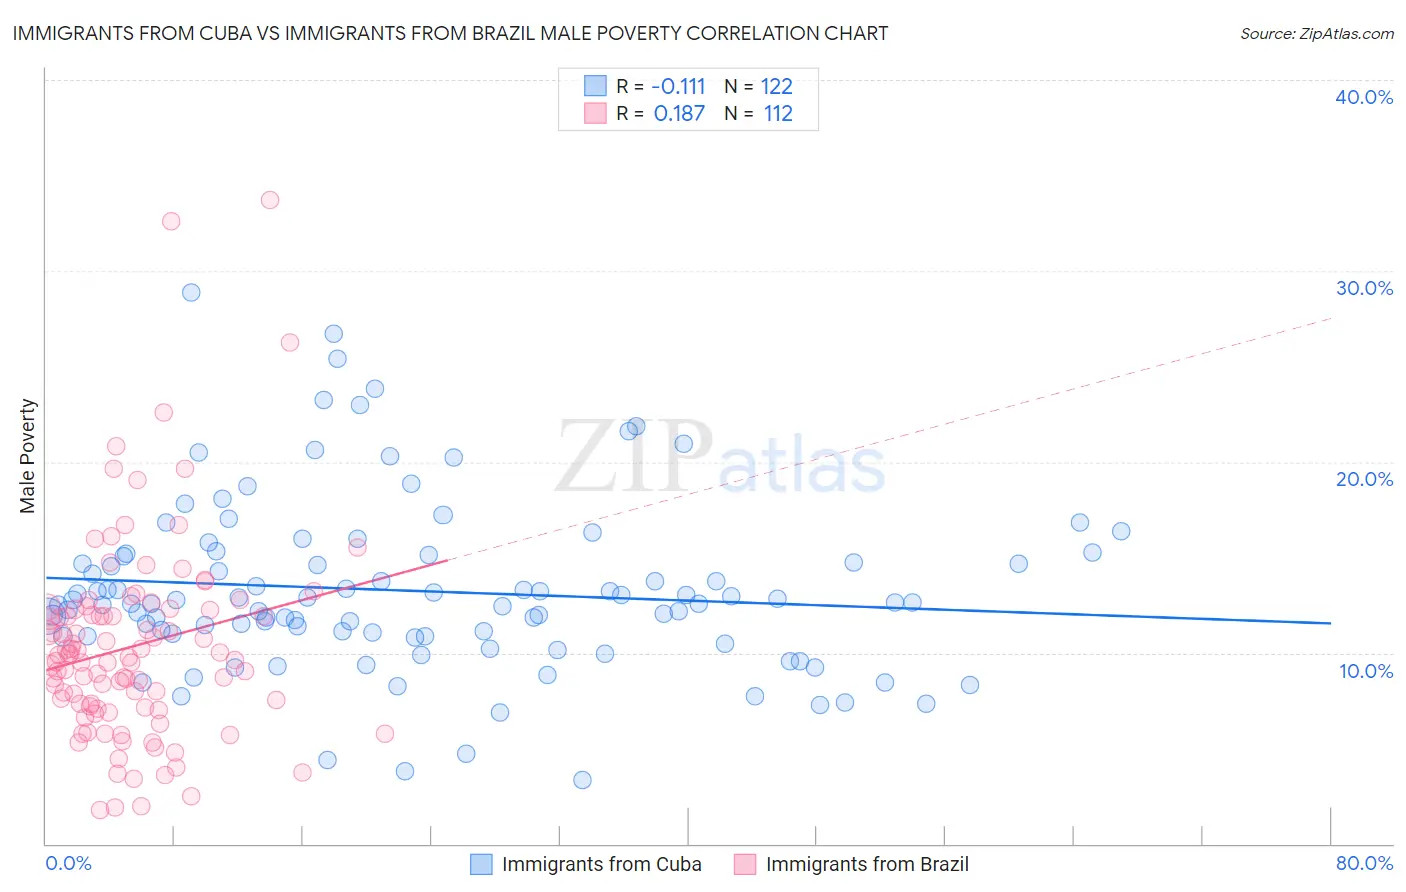
Immigrants from Cuba vs Immigrants from Brazil Male Poverty Correlation Chart

The statistical analysis conducted on geographies consisting of 325,880,105 people shows a poor negative correlation between the proportion of Immigrants from Cuba and poverty level among males in the United States with a correlation coefficient (R) of -0.111 and weighted average of 12.9%. Similarly, the statistical analysis conducted on geographies consisting of 342,783,904 people shows a poor positive correlation between the proportion of Immigrants from Brazil and poverty level among males in the United States with a correlation coefficient (R) of 0.187 and weighted average of 10.6%, a difference of 21.7%.
Immigrants from Cuba vs Immigrants from Brazil Male Poverty

Male Poverty Correlation Summary

MeasurementImmigrants from CubaImmigrants from Brazil
Minimum3.3%1.8%
Maximum28.9%33.7%
Range25.5%31.9%
Mean13.2%10.3%
Median12.6%9.7%
Interquartile 25% (IQ1)10.9%7.2%
Interquartile 75% (IQ3)15.1%12.3%
Interquartile Range (IQR)4.2%5.1%
Standard Deviation (Sample)4.5%5.3%
Standard Deviation (Population)4.5%5.3%

Similar Demographics by Male Poverty

Demographics Similar to Immigrants from Cuba by Male Poverty

In terms of male poverty, the demographic groups most similar to Immigrants from Cuba are Immigrants from Ecuador (12.9%, a difference of 0.030%), Immigrants from Ghana (12.9%, a difference of 0.080%), Immigrants from Nicaragua (12.9%, a difference of 0.10%), Potawatomi (12.9%, a difference of 0.11%), and Immigrants from Sudan (12.9%, a difference of 0.18%).
DemographicsRating | RankMale Poverty
Tsimshian
0.3
/100
|
#244
Tragic
12.8%
Liberians
0.3
/100
|
#245
Tragic
12.8%
Immigrants | El Salvador
0.2
/100
|
#246
Tragic
12.8%
Immigrants | Western Africa
0.2
/100
|
#247
Tragic
12.9%
Immigrants | Sudan
0.2
/100
|
#248
Tragic
12.9%
Potawatomi
0.2
/100
|
#249
Tragic
12.9%
Immigrants | Nicaragua
0.2
/100
|
#250
Tragic
12.9%
Immigrants | Cuba
0.2
/100
|
#251
Tragic
12.9%
Immigrants | Ecuador
0.2
/100
|
#252
Tragic
12.9%
Immigrants | Ghana
0.2
/100
|
#253
Tragic
12.9%
Mexican American Indians
0.1
/100
|
#254
Tragic
13.0%
Immigrants | Liberia
0.1
/100
|
#255
Tragic
13.0%
Immigrants | Burma/Myanmar
0.1
/100
|
#256
Tragic
13.0%
Immigrants | Trinidad and Tobago
0.1
/100
|
#257
Tragic
13.1%
Cape Verdeans
0.1
/100
|
#258
Tragic
13.1%

Demographics Similar to Immigrants from Brazil by Male Poverty

In terms of male poverty, the demographic groups most similar to Immigrants from Brazil are Palestinian (10.6%, a difference of 0.020%), Immigrants from Turkey (10.6%, a difference of 0.12%), Immigrants from Russia (10.6%, a difference of 0.12%), Immigrants from Argentina (10.6%, a difference of 0.20%), and Sri Lankan (10.6%, a difference of 0.23%).
DemographicsRating | RankMale Poverty
Laotians
91.2
/100
|
#107
Exceptional
10.5%
Portuguese
91.0
/100
|
#108
Exceptional
10.6%
Albanians
90.6
/100
|
#109
Exceptional
10.6%
Argentineans
90.1
/100
|
#110
Exceptional
10.6%
Immigrants | Argentina
89.8
/100
|
#111
Excellent
10.6%
Immigrants | Turkey
89.5
/100
|
#112
Excellent
10.6%
Palestinians
89.1
/100
|
#113
Excellent
10.6%
Immigrants | Brazil
89.0
/100
|
#114
Excellent
10.6%
Immigrants | Russia
88.6
/100
|
#115
Excellent
10.6%
Sri Lankans
88.1
/100
|
#116
Excellent
10.6%
Immigrants | South Eastern Asia
88.1
/100
|
#117
Excellent
10.6%
Okinawans
87.6
/100
|
#118
Excellent
10.7%
Immigrants | Hungary
87.6
/100
|
#119
Excellent
10.7%
Immigrants | China
87.1
/100
|
#120
Excellent
10.7%
Peruvians
87.1
/100
|
#121
Excellent
10.7%