Seminole vs Immigrants from Brazil Male Poverty

COMPARE

Seminole
Race
Ancestry
AfghanAfricanAlaska NativeAlaskan AthabascanAlbanianAleutAlsatianAmericanApacheArabArapahoArgentineanArmenianAssyrian/Chaldean/SyriacAustralianAustrianBahamianBangladeshiBarbadianBasqueBelgianBelizeanBermudanBhutaneseBlackfeetBolivianBrazilianBritishBritish West IndianBulgarianBurmeseCajunCambodianCanadianCape VerdeanCarpatho RusynCelticCentral AmericanCentral American IndianCherokeeCheyenneChickasawChileanChineseChippewaChoctawColombianColvilleComancheCosta RicanCreeCreekCroatianCrowCubanCypriotCzechCzechoslovakianDanishDelawareDominicanDutchDutch West IndianEastern EuropeanEcuadorianEgyptianEnglishEstonianEthiopianEuropeanFijianFilipinoFinnishFrenchFrench American IndianFrench CanadianGermanGerman RussianGhanaianGreekGuamanian/ChamorroGuatemalanGuyaneseHaitianHmongHonduranHopiHoumaHungarianIcelanderIndian (Asian)IndonesianInupiatIranianIraqiIrishIroquoisIsraeliItalianJamaicanJapaneseJordanianKenyanKiowaKoreanLaotianLatvianLebaneseLiberianLithuanianLumbeeLuxembourgerMacedonianMalaysianMalteseMarshalleseMenomineeMexicanMexican American IndianMongolianMoroccanNative HawaiianNavajoNepaleseNew ZealanderNicaraguanNigerianNorthern EuropeanNorwegianOkinawanOsageOttawaPaiutePakistaniPalestinianPanamanianParaguayanPennsylvania GermanPeruvianPimaPolishPortuguesePotawatomiPuebloPuerto RicanPuget Sound SalishRomanianRussianSalvadoranSamoanScandinavianScotch-IrishScottishSeminoleSenegaleseSerbianShoshoneSierra LeoneanSiouxSlavicSlovakSloveneSomaliSouth AfricanSouth AmericanSouth American IndianSoviet UnionSpaniardSpanishSpanish AmericanSpanish American IndianSri LankanSubsaharan AfricanSudaneseSwedishSwissSyrianTaiwaneseThaiTlingit-HaidaTohono O'OdhamTonganTrinidadian and TobagonianTsimshianTurkishU.S. Virgin IslanderUgandanUkrainianUruguayanUteVenezuelanVietnameseWelshWest IndianYakamaYaquiYugoslavianYumanYup'ikZimbabwean
Immigration
NonimmigrantsImmigrantsAfghanistanAfricaAlbaniaArgentinaArmeniaAsiaAustraliaAustriaBahamasBangladeshBarbadosBelarusBelgiumBelizeBoliviaBosnia and HerzegovinaBulgariaBurma/MyanmarCabo VerdeCambodiaCameroonCanadaCaribbeanCentral AmericaChileChinaColombiaCongoCosta RicaCroatiaCubaCzechoslovakiaDenmarkDominicaDominican RepublicEastern AfricaEastern AsiaEastern EuropeEcuadorEgyptEl SalvadorEnglandEritreaEthiopiaEuropeFijiFranceGermanyGhanaGreeceGrenadaGuatemalaGuyanaHaitiHondurasHong KongHungaryIndiaIndonesiaIranIraqIrelandIsraelItalyJamaicaJapanJordanKazakhstanKenyaKoreaKuwaitLaosLatin AmericaLatviaLebanonLiberiaLithuaniaMalaysiaMexicoMicronesiaMiddle AfricaMoldovaMoroccoNepalNetherlandsNicaraguaNigeriaNorth AmericaNorth MacedoniaNorthern AfricaNorthern EuropeNorwayOceaniaPakistanPanamaPeruPhilippinesPolandPortugalRomaniaRussiaSaudi ArabiaScotlandSenegalSerbiaSierra LeoneSingaporeSomaliaSouth AfricaSouth AmericaSouth Central AsiaSouth Eastern AsiaSouthern EuropeSpainSri LankaSt. Vincent and the GrenadinesSudanSwedenSwitzerlandSyriaTaiwanThailandTrinidad and TobagoTurkeyUgandaUkraineUruguayUzbekistanVenezuelaVietnamWest IndiesWestern AfricaWestern AsiaWestern EuropeYemenZaireZimbabweAzores
Immigrants from Brazil
Race
Ancestry
AfghanAfricanAlaska NativeAlaskan AthabascanAlbanianAleutAlsatianAmericanApacheArabArapahoArgentineanArmenianAssyrian/Chaldean/SyriacAustralianAustrianBahamianBangladeshiBarbadianBasqueBelgianBelizeanBermudanBhutaneseBlackfeetBolivianBrazilianBritishBritish West IndianBulgarianBurmeseCajunCambodianCanadianCape VerdeanCarpatho RusynCelticCentral AmericanCentral American IndianCherokeeCheyenneChickasawChileanChineseChippewaChoctawColombianColvilleComancheCosta RicanCreeCreekCroatianCrowCubanCypriotCzechCzechoslovakianDanishDelawareDominicanDutchDutch West IndianEastern EuropeanEcuadorianEgyptianEnglishEstonianEthiopianEuropeanFijianFilipinoFinnishFrenchFrench American IndianFrench CanadianGermanGerman RussianGhanaianGreekGuamanian/ChamorroGuatemalanGuyaneseHaitianHmongHonduranHopiHoumaHungarianIcelanderIndian (Asian)IndonesianInupiatIranianIraqiIrishIroquoisIsraeliItalianJamaicanJapaneseJordanianKenyanKiowaKoreanLaotianLatvianLebaneseLiberianLithuanianLumbeeLuxembourgerMacedonianMalaysianMalteseMarshalleseMenomineeMexicanMexican American IndianMongolianMoroccanNative HawaiianNavajoNepaleseNew ZealanderNicaraguanNigerianNorthern EuropeanNorwegianOkinawanOsageOttawaPaiutePakistaniPalestinianPanamanianParaguayanPennsylvania GermanPeruvianPimaPolishPortuguesePotawatomiPuebloPuerto RicanPuget Sound SalishRomanianRussianSalvadoranSamoanScandinavianScotch-IrishScottishSenegaleseSerbianShoshoneSierra LeoneanSiouxSlavicSlovakSloveneSomaliSouth AfricanSouth AmericanSouth American IndianSoviet UnionSpaniardSpanishSpanish AmericanSpanish American IndianSri LankanSubsaharan AfricanSudaneseSwedishSwissSyrianTaiwaneseThaiTlingit-HaidaTohono O'OdhamTonganTrinidadian and TobagonianTsimshianTurkishU.S. Virgin IslanderUgandanUkrainianUruguayanUteVenezuelanVietnameseWelshWest IndianYakamaYaquiYugoslavianYumanYup'ikZimbabwean
Immigration
NonimmigrantsImmigrantsAfghanistanAfricaAlbaniaArgentinaArmeniaAsiaAustraliaAustriaBahamasBangladeshBarbadosBelarusBelgiumBelizeBoliviaBosnia and HerzegovinaBrazilBulgariaBurma/MyanmarCabo VerdeCambodiaCameroonCanadaCaribbeanCentral AmericaChileChinaColombiaCongoCosta RicaCroatiaCubaCzechoslovakiaDenmarkDominicaDominican RepublicEastern AfricaEastern AsiaEastern EuropeEcuadorEgyptEl SalvadorEnglandEritreaEthiopiaEuropeFijiFranceGermanyGhanaGreeceGrenadaGuatemalaGuyanaHaitiHondurasHong KongHungaryIndiaIndonesiaIranIraqIrelandIsraelItalyJamaicaJapanJordanKazakhstanKenyaKoreaKuwaitLaosLatin AmericaLatviaLebanonLiberiaLithuaniaMalaysiaMexicoMicronesiaMiddle AfricaMoldovaMoroccoNepalNetherlandsNicaraguaNigeriaNorth AmericaNorth MacedoniaNorthern AfricaNorthern EuropeNorwayOceaniaPakistanPanamaPeruPhilippinesPolandPortugalRomaniaRussiaSaudi ArabiaScotlandSenegalSerbiaSierra LeoneSingaporeSomaliaSouth AfricaSouth AmericaSouth Central AsiaSouth Eastern AsiaSouthern EuropeSpainSri LankaSt. Vincent and the GrenadinesSudanSwedenSwitzerlandSyriaTaiwanThailandTrinidad and TobagoTurkeyUgandaUkraineUruguayUzbekistanVenezuelaVietnamWest IndiesWestern AfricaWestern AsiaWestern EuropeYemenZaireZimbabweAzores
Male Poverty
Income
Poverty
Unemployment
Labor Participation
Family Structure
Vehicle Availability
Education Level
Disability

Male Poverty Comparison

Seminole

Immigrants from Brazil

Tragic
Excellent
14.3%
MALE POVERTY
0.0/ 100
METRIC RATING
310th/ 347
METRIC RANK
10.6%
MALE POVERTY
89.0/ 100
METRIC RATING
114th/ 347
METRIC RANK

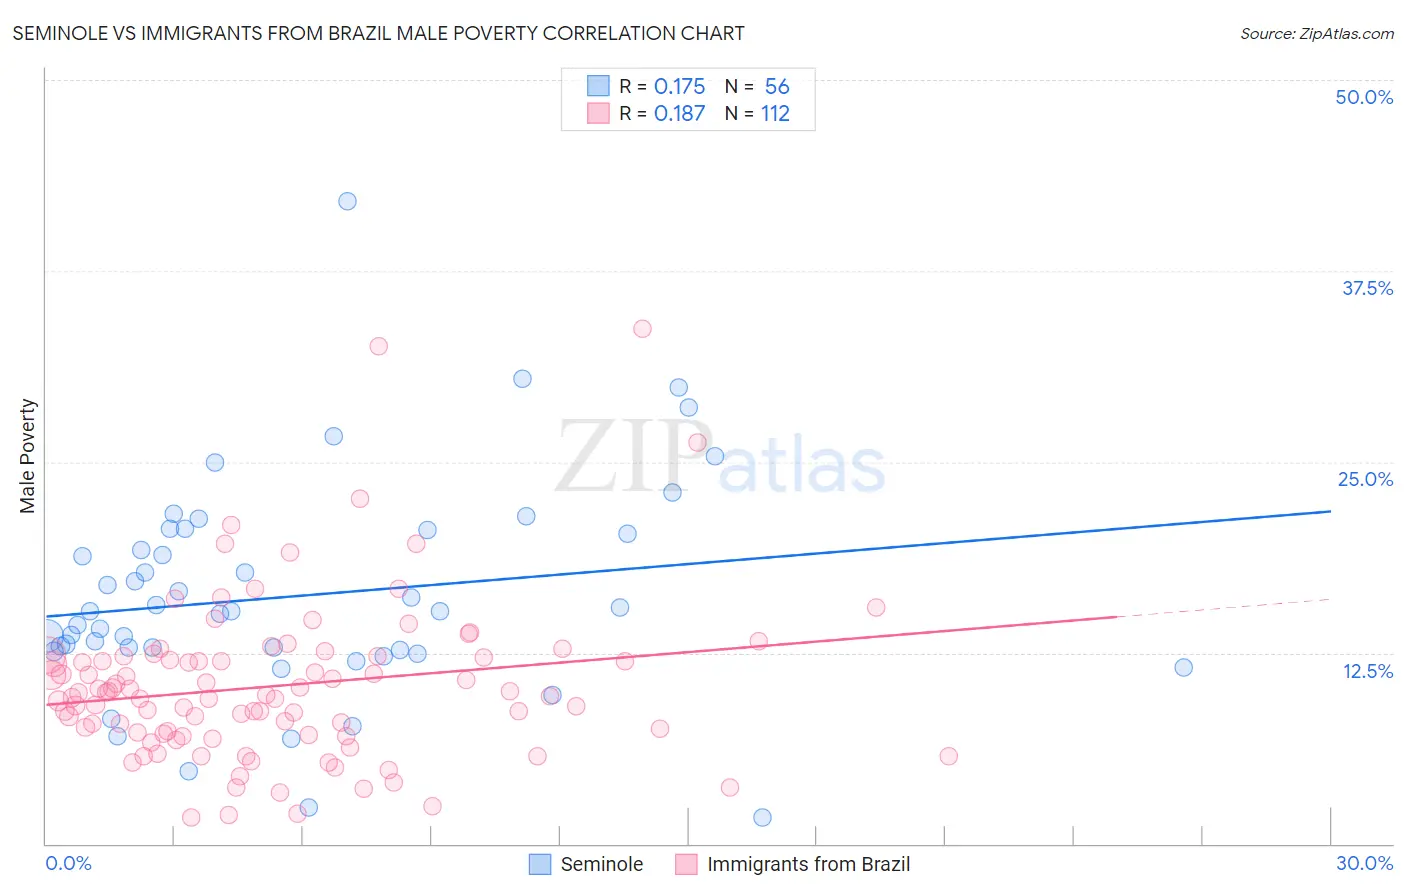
Seminole vs Immigrants from Brazil Male Poverty Correlation Chart

The statistical analysis conducted on geographies consisting of 118,283,543 people shows a poor positive correlation between the proportion of Seminole and poverty level among males in the United States with a correlation coefficient (R) of 0.175 and weighted average of 14.3%. Similarly, the statistical analysis conducted on geographies consisting of 342,783,904 people shows a poor positive correlation between the proportion of Immigrants from Brazil and poverty level among males in the United States with a correlation coefficient (R) of 0.187 and weighted average of 10.6%, a difference of 34.7%.
Seminole vs Immigrants from Brazil Male Poverty

Male Poverty Correlation Summary

MeasurementSeminoleImmigrants from Brazil
Minimum1.7%1.8%
Maximum42.0%33.7%
Range40.3%31.9%
Mean16.2%10.3%
Median15.2%9.7%
Interquartile 25% (IQ1)12.6%7.2%
Interquartile 75% (IQ3)20.4%12.3%
Interquartile Range (IQR)7.8%5.1%
Standard Deviation (Sample)7.1%5.3%
Standard Deviation (Population)7.1%5.3%

Similar Demographics by Male Poverty

Demographics Similar to Seminole by Male Poverty

In terms of male poverty, the demographic groups most similar to Seminole are Somali (14.3%, a difference of 0.20%), Honduran (14.3%, a difference of 0.21%), African (14.2%, a difference of 0.58%), Dutch West Indian (14.2%, a difference of 0.60%), and Choctaw (14.4%, a difference of 0.67%).
DemographicsRating | RankMale Poverty
Bahamians
0.0
/100
|
#303
Tragic
14.1%
Senegalese
0.0
/100
|
#304
Tragic
14.1%
Immigrants | Bangladesh
0.0
/100
|
#305
Tragic
14.1%
Creek
0.0
/100
|
#306
Tragic
14.1%
Dutch West Indians
0.0
/100
|
#307
Tragic
14.2%
Africans
0.0
/100
|
#308
Tragic
14.2%
Somalis
0.0
/100
|
#309
Tragic
14.3%
Seminole
0.0
/100
|
#310
Tragic
14.3%
Hondurans
0.0
/100
|
#311
Tragic
14.3%
Choctaw
0.0
/100
|
#312
Tragic
14.4%
Immigrants | Somalia
0.0
/100
|
#313
Tragic
14.6%
Immigrants | Honduras
0.0
/100
|
#314
Tragic
14.6%
Chippewa
0.0
/100
|
#315
Tragic
14.6%
British West Indians
0.0
/100
|
#316
Tragic
14.6%
Immigrants | Dominica
0.0
/100
|
#317
Tragic
14.7%

Demographics Similar to Immigrants from Brazil by Male Poverty

In terms of male poverty, the demographic groups most similar to Immigrants from Brazil are Palestinian (10.6%, a difference of 0.020%), Immigrants from Turkey (10.6%, a difference of 0.12%), Immigrants from Russia (10.6%, a difference of 0.12%), Immigrants from Argentina (10.6%, a difference of 0.20%), and Sri Lankan (10.6%, a difference of 0.23%).
DemographicsRating | RankMale Poverty
Laotians
91.2
/100
|
#107
Exceptional
10.5%
Portuguese
91.0
/100
|
#108
Exceptional
10.6%
Albanians
90.6
/100
|
#109
Exceptional
10.6%
Argentineans
90.1
/100
|
#110
Exceptional
10.6%
Immigrants | Argentina
89.8
/100
|
#111
Excellent
10.6%
Immigrants | Turkey
89.5
/100
|
#112
Excellent
10.6%
Palestinians
89.1
/100
|
#113
Excellent
10.6%
Immigrants | Brazil
89.0
/100
|
#114
Excellent
10.6%
Immigrants | Russia
88.6
/100
|
#115
Excellent
10.6%
Sri Lankans
88.1
/100
|
#116
Excellent
10.6%
Immigrants | South Eastern Asia
88.1
/100
|
#117
Excellent
10.6%
Okinawans
87.6
/100
|
#118
Excellent
10.7%
Immigrants | Hungary
87.6
/100
|
#119
Excellent
10.7%
Immigrants | China
87.1
/100
|
#120
Excellent
10.7%
Peruvians
87.1
/100
|
#121
Excellent
10.7%