Vietnamese vs Nonimmigrants Single Male Poverty

COMPARE

Vietnamese
Race
Ancestry
AfghanAfricanAlaska NativeAlaskan AthabascanAlbanianAleutAlsatianAmericanApacheArabArapahoArgentineanArmenianAssyrian/Chaldean/SyriacAustralianAustrianBahamianBangladeshiBarbadianBasqueBelgianBelizeanBermudanBhutaneseBlackfeetBolivianBrazilianBritishBritish West IndianBulgarianBurmeseCajunCambodianCanadianCape VerdeanCarpatho RusynCelticCentral AmericanCentral American IndianCherokeeCheyenneChickasawChileanChineseChippewaChoctawColombianColvilleComancheCosta RicanCreeCreekCroatianCrowCubanCypriotCzechCzechoslovakianDanishDelawareDominicanDutchDutch West IndianEastern EuropeanEcuadorianEgyptianEnglishEstonianEthiopianEuropeanFijianFilipinoFinnishFrenchFrench American IndianFrench CanadianGermanGerman RussianGhanaianGreekGuamanian/ChamorroGuatemalanGuyaneseHaitianHmongHonduranHopiHoumaHungarianIcelanderIndian (Asian)IndonesianInupiatIranianIraqiIrishIroquoisIsraeliItalianJamaicanJapaneseJordanianKenyanKiowaKoreanLaotianLatvianLebaneseLiberianLithuanianLumbeeLuxembourgerMacedonianMalaysianMalteseMarshalleseMenomineeMexicanMexican American IndianMongolianMoroccanNative HawaiianNavajoNepaleseNew ZealanderNicaraguanNigerianNorthern EuropeanNorwegianOkinawanOsageOttawaPaiutePakistaniPalestinianPanamanianParaguayanPennsylvania GermanPeruvianPimaPolishPortuguesePotawatomiPuebloPuerto RicanPuget Sound SalishRomanianRussianSalvadoranSamoanScandinavianScotch-IrishScottishSeminoleSenegaleseSerbianShoshoneSierra LeoneanSiouxSlavicSlovakSloveneSomaliSouth AfricanSouth AmericanSouth American IndianSoviet UnionSpaniardSpanishSpanish AmericanSpanish American IndianSri LankanSubsaharan AfricanSudaneseSwedishSwissSyrianTaiwaneseThaiTlingit-HaidaTohono O'OdhamTonganTrinidadian and TobagonianTsimshianTurkishU.S. Virgin IslanderUgandanUkrainianUruguayanUteVenezuelanVietnameseWelshWest IndianYakamaYaquiYugoslavianYumanYup'ikZimbabwean
Immigration
ImmigrantsAfghanistanAfricaAlbaniaArgentinaArmeniaAsiaAustraliaAustriaBahamasBangladeshBarbadosBelarusBelgiumBelizeBoliviaBosnia and HerzegovinaBrazilBulgariaBurma/MyanmarCabo VerdeCambodiaCameroonCanadaCaribbeanCentral AmericaChileChinaColombiaCongoCosta RicaCroatiaCubaCzechoslovakiaDenmarkDominicaDominican RepublicEastern AfricaEastern AsiaEastern EuropeEcuadorEgyptEl SalvadorEnglandEritreaEthiopiaEuropeFijiFranceGermanyGhanaGreeceGrenadaGuatemalaGuyanaHaitiHondurasHong KongHungaryIndiaIndonesiaIranIraqIrelandIsraelItalyJamaicaJapanJordanKazakhstanKenyaKoreaKuwaitLaosLatin AmericaLatviaLebanonLiberiaLithuaniaMalaysiaMexicoMicronesiaMiddle AfricaMoldovaMoroccoNepalNetherlandsNicaraguaNigeriaNorth AmericaNorth MacedoniaNorthern AfricaNorthern EuropeNorwayOceaniaPakistanPanamaPeruPhilippinesPolandPortugalRomaniaRussiaSaudi ArabiaScotlandSenegalSerbiaSierra LeoneSingaporeSomaliaSouth AfricaSouth AmericaSouth Central AsiaSouth Eastern AsiaSouthern EuropeSpainSri LankaSt. Vincent and the GrenadinesSudanSwedenSwitzerlandSyriaTaiwanThailandTrinidad and TobagoTurkeyUgandaUkraineUruguayUzbekistanVenezuelaVietnamWest IndiesWestern AfricaWestern AsiaWestern EuropeYemenZaireZimbabweAzores
Nonimmigrants
Race
Ancestry
AfghanAfricanAlaska NativeAlaskan AthabascanAlbanianAleutAlsatianAmericanApacheArabArapahoArgentineanArmenianAssyrian/Chaldean/SyriacAustralianAustrianBahamianBangladeshiBarbadianBasqueBelgianBelizeanBermudanBhutaneseBlackfeetBolivianBrazilianBritishBritish West IndianBulgarianBurmeseCajunCambodianCanadianCape VerdeanCarpatho RusynCelticCentral AmericanCentral American IndianCherokeeCheyenneChickasawChileanChineseChippewaChoctawColombianColvilleComancheCosta RicanCreeCreekCroatianCrowCubanCypriotCzechCzechoslovakianDanishDelawareDominicanDutchDutch West IndianEastern EuropeanEcuadorianEgyptianEnglishEstonianEthiopianEuropeanFijianFilipinoFinnishFrenchFrench American IndianFrench CanadianGermanGerman RussianGhanaianGreekGuamanian/ChamorroGuatemalanGuyaneseHaitianHmongHonduranHopiHoumaHungarianIcelanderIndian (Asian)IndonesianInupiatIranianIraqiIrishIroquoisIsraeliItalianJamaicanJapaneseJordanianKenyanKiowaKoreanLaotianLatvianLebaneseLiberianLithuanianLumbeeLuxembourgerMacedonianMalaysianMalteseMarshalleseMenomineeMexicanMexican American IndianMongolianMoroccanNative HawaiianNavajoNepaleseNew ZealanderNicaraguanNigerianNorthern EuropeanNorwegianOkinawanOsageOttawaPaiutePakistaniPalestinianPanamanianParaguayanPennsylvania GermanPeruvianPimaPolishPortuguesePotawatomiPuebloPuerto RicanPuget Sound SalishRomanianRussianSalvadoranSamoanScandinavianScotch-IrishScottishSeminoleSenegaleseSerbianShoshoneSierra LeoneanSiouxSlavicSlovakSloveneSomaliSouth AfricanSouth AmericanSouth American IndianSoviet UnionSpaniardSpanishSpanish AmericanSpanish American IndianSri LankanSubsaharan AfricanSudaneseSwedishSwissSyrianTaiwaneseThaiTlingit-HaidaTohono O'OdhamTonganTrinidadian and TobagonianTsimshianTurkishU.S. Virgin IslanderUgandanUkrainianUruguayanUteVenezuelanWelshWest IndianYakamaYaquiYugoslavianYumanYup'ikZimbabwean
Immigration
NonimmigrantsImmigrantsAfghanistanAfricaAlbaniaArgentinaArmeniaAsiaAustraliaAustriaBahamasBangladeshBarbadosBelarusBelgiumBelizeBoliviaBosnia and HerzegovinaBrazilBulgariaBurma/MyanmarCabo VerdeCambodiaCameroonCanadaCaribbeanCentral AmericaChileChinaColombiaCongoCosta RicaCroatiaCubaCzechoslovakiaDenmarkDominicaDominican RepublicEastern AfricaEastern AsiaEastern EuropeEcuadorEgyptEl SalvadorEnglandEritreaEthiopiaEuropeFijiFranceGermanyGhanaGreeceGrenadaGuatemalaGuyanaHaitiHondurasHong KongHungaryIndiaIndonesiaIranIraqIrelandIsraelItalyJamaicaJapanJordanKazakhstanKenyaKoreaKuwaitLaosLatin AmericaLatviaLebanonLiberiaLithuaniaMalaysiaMexicoMicronesiaMiddle AfricaMoldovaMoroccoNepalNetherlandsNicaraguaNigeriaNorth AmericaNorth MacedoniaNorthern AfricaNorthern EuropeNorwayOceaniaPakistanPanamaPeruPhilippinesPolandPortugalRomaniaRussiaSaudi ArabiaScotlandSenegalSerbiaSierra LeoneSingaporeSomaliaSouth AfricaSouth AmericaSouth Central AsiaSouth Eastern AsiaSouthern EuropeSpainSri LankaSt. Vincent and the GrenadinesSudanSwedenSwitzerlandSyriaTaiwanThailandTrinidad and TobagoTurkeyUgandaUkraineUruguayUzbekistanVenezuelaVietnamWest IndiesWestern AfricaWestern AsiaWestern EuropeYemenZaireZimbabweAzores
Single Male Poverty
Income
Poverty
Unemployment
Labor Participation
Family Structure
Vehicle Availability
Education Level
Disability

Single Male Poverty Comparison

Vietnamese

Nonimmigrants

Good
Tragic
12.7%
SINGLE MALE POVERTY
67.9/ 100
METRIC RATING
156th/ 347
METRIC RANK
14.6%
SINGLE MALE POVERTY
0.0/ 100
METRIC RATING
292nd/ 347
METRIC RANK

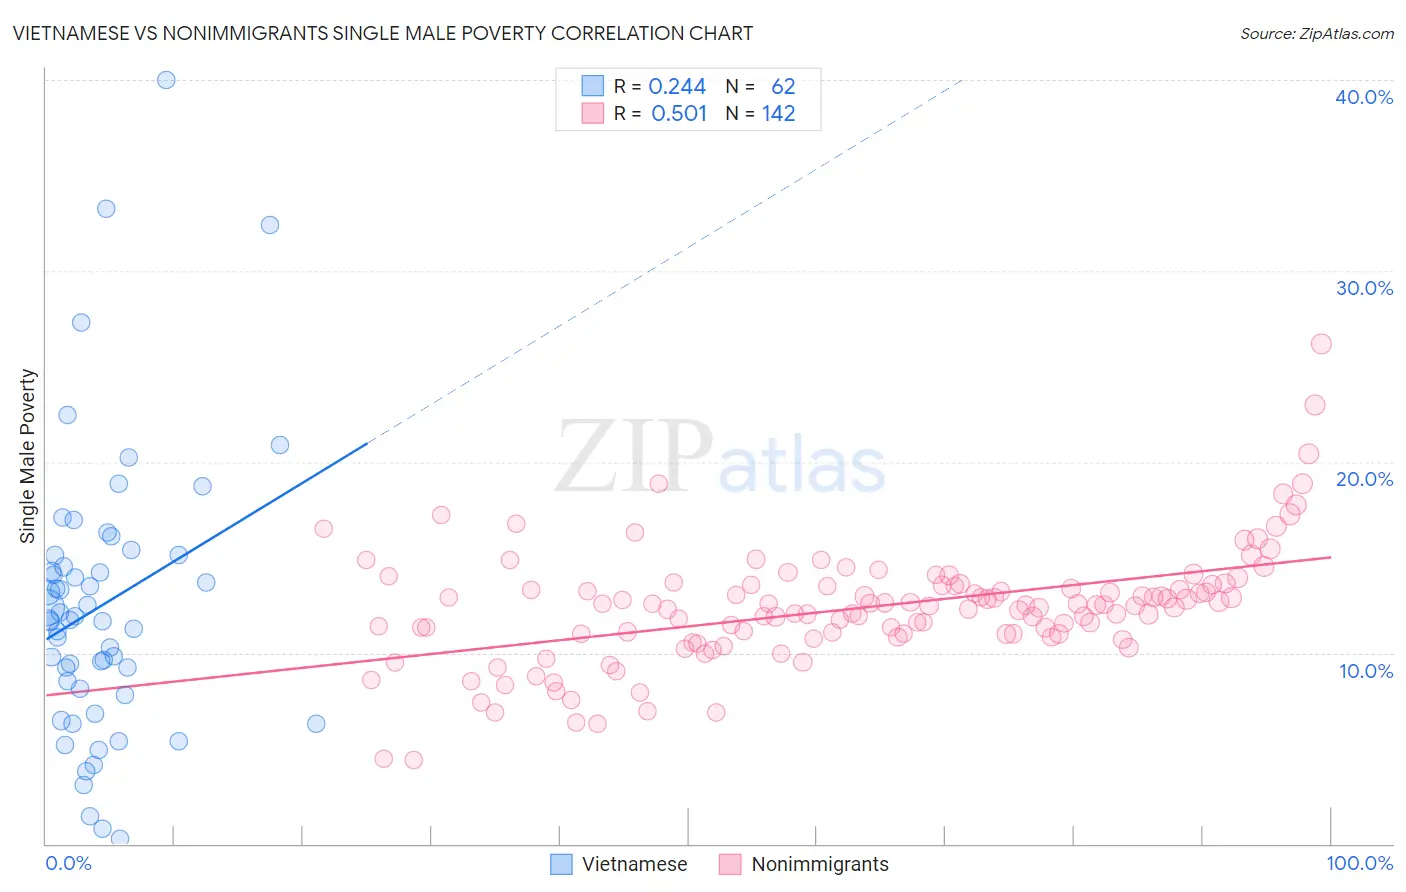
Vietnamese vs Nonimmigrants Single Male Poverty Correlation Chart

The statistical analysis conducted on geographies consisting of 159,434,170 people shows a weak positive correlation between the proportion of Vietnamese and poverty level among single males in the United States with a correlation coefficient (R) of 0.244 and weighted average of 12.7%. Similarly, the statistical analysis conducted on geographies consisting of 470,347,723 people shows a substantial positive correlation between the proportion of Nonimmigrants and poverty level among single males in the United States with a correlation coefficient (R) of 0.501 and weighted average of 14.6%, a difference of 15.0%.
Vietnamese vs Nonimmigrants Single Male Poverty

Single Male Poverty Correlation Summary

MeasurementVietnameseNonimmigrants
Minimum0.23%4.4%
Maximum40.0%26.2%
Range39.8%21.8%
Mean12.5%12.4%
Median11.7%12.5%
Interquartile 25% (IQ1)8.1%11.0%
Interquartile 75% (IQ3)15.1%13.5%
Interquartile Range (IQR)7.0%2.5%
Standard Deviation (Sample)7.4%3.1%
Standard Deviation (Population)7.4%3.1%

Similar Demographics by Single Male Poverty

Demographics Similar to Vietnamese by Single Male Poverty

In terms of single male poverty, the demographic groups most similar to Vietnamese are Latvian (12.7%, a difference of 0.0%), Immigrants from Spain (12.7%, a difference of 0.040%), Immigrants from Scotland (12.7%, a difference of 0.060%), Immigrants (12.7%, a difference of 0.13%), and Immigrants from Middle Africa (12.7%, a difference of 0.18%).
DemographicsRating | RankSingle Male Poverty
Sierra Leoneans
73.0
/100
|
#149
Good
12.6%
Immigrants | Panama
72.1
/100
|
#150
Good
12.6%
Immigrants | Hungary
71.9
/100
|
#151
Good
12.6%
Australians
71.4
/100
|
#152
Good
12.6%
Immigrants | Immigrants
70.1
/100
|
#153
Good
12.7%
Immigrants | Scotland
68.9
/100
|
#154
Good
12.7%
Immigrants | Spain
68.7
/100
|
#155
Good
12.7%
Vietnamese
67.9
/100
|
#156
Good
12.7%
Latvians
67.9
/100
|
#157
Good
12.7%
Immigrants | Middle Africa
64.9
/100
|
#158
Good
12.7%
Immigrants | Liberia
64.2
/100
|
#159
Good
12.7%
Greeks
64.1
/100
|
#160
Good
12.7%
Immigrants | Africa
63.4
/100
|
#161
Good
12.7%
Eastern Europeans
63.3
/100
|
#162
Good
12.7%
Palestinians
63.1
/100
|
#163
Good
12.7%

Demographics Similar to Nonimmigrants by Single Male Poverty

In terms of single male poverty, the demographic groups most similar to Nonimmigrants are French Canadian (14.6%, a difference of 0.11%), Bahamian (14.6%, a difference of 0.13%), U.S. Virgin Islander (14.5%, a difference of 0.28%), Ottawa (14.6%, a difference of 0.30%), and Immigrants from Dominica (14.5%, a difference of 0.51%).
DemographicsRating | RankSingle Male Poverty
French
0.0
/100
|
#285
Tragic
14.4%
Celtics
0.0
/100
|
#286
Tragic
14.5%
Iroquois
0.0
/100
|
#287
Tragic
14.5%
Whites/Caucasians
0.0
/100
|
#288
Tragic
14.5%
Immigrants | Dominica
0.0
/100
|
#289
Tragic
14.5%
U.S. Virgin Islanders
0.0
/100
|
#290
Tragic
14.5%
Bahamians
0.0
/100
|
#291
Tragic
14.6%
Immigrants | Nonimmigrants
0.0
/100
|
#292
Tragic
14.6%
French Canadians
0.0
/100
|
#293
Tragic
14.6%
Ottawa
0.0
/100
|
#294
Tragic
14.6%
Scotch-Irish
0.0
/100
|
#295
Tragic
14.7%
Africans
0.0
/100
|
#296
Tragic
14.7%
Immigrants | Dominican Republic
0.0
/100
|
#297
Tragic
14.8%
French American Indians
0.0
/100
|
#298
Tragic
15.0%
Delaware
0.0
/100
|
#299
Tragic
15.0%