Vietnamese vs Cheyenne Single Male Poverty
COMPARE
Vietnamese
Cheyenne
Single Male Poverty
Single Male Poverty Comparison
Vietnamese
Cheyenne
12.7%
SINGLE MALE POVERTY
67.9/ 100
METRIC RATING
156th/ 347
METRIC RANK
16.1%
SINGLE MALE POVERTY
0.0/ 100
METRIC RATING
315th/ 347
METRIC RANK
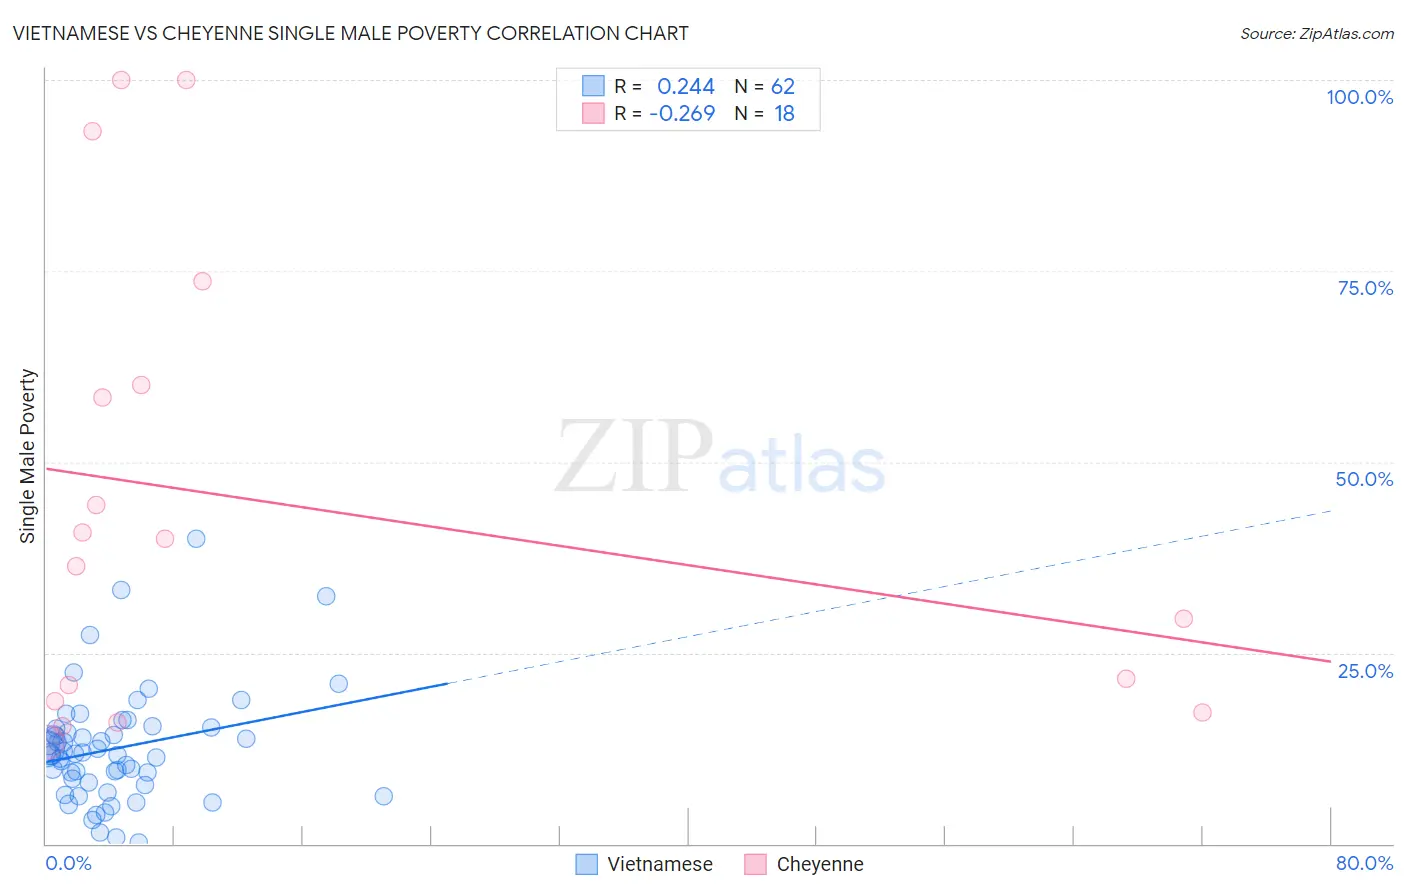
Vietnamese vs Cheyenne Single Male Poverty Correlation Chart
The statistical analysis conducted on geographies consisting of 159,434,170 people shows a weak positive correlation between the proportion of Vietnamese and poverty level among single males in the United States with a correlation coefficient (R) of 0.244 and weighted average of 12.7%. Similarly, the statistical analysis conducted on geographies consisting of 78,255,059 people shows a weak negative correlation between the proportion of Cheyenne and poverty level among single males in the United States with a correlation coefficient (R) of -0.269 and weighted average of 16.1%, a difference of 27.1%.
Single Male Poverty Correlation Summary
| Measurement | Vietnamese | Cheyenne |
| Minimum | 0.23% | 13.3% |
| Maximum | 40.0% | 100.0% |
| Range | 39.8% | 86.7% |
| Mean | 12.5% | 44.4% |
| Median | 11.7% | 38.2% |
| Interquartile 25% (IQ1) | 8.1% | 18.7% |
| Interquartile 75% (IQ3) | 15.1% | 60.0% |
| Interquartile Range (IQR) | 7.0% | 41.3% |
| Standard Deviation (Sample) | 7.4% | 30.0% |
| Standard Deviation (Population) | 7.4% | 29.1% |
Similar Demographics by Single Male Poverty
Demographics Similar to Vietnamese by Single Male Poverty
In terms of single male poverty, the demographic groups most similar to Vietnamese are Latvian (12.7%, a difference of 0.0%), Immigrants from Spain (12.7%, a difference of 0.040%), Immigrants from Scotland (12.7%, a difference of 0.060%), Immigrants (12.7%, a difference of 0.13%), and Immigrants from Middle Africa (12.7%, a difference of 0.18%).
| Demographics | Rating | Rank | Single Male Poverty |
| Sierra Leoneans | 73.0 /100 | #149 | Good 12.6% |
| Immigrants | Panama | 72.1 /100 | #150 | Good 12.6% |
| Immigrants | Hungary | 71.9 /100 | #151 | Good 12.6% |
| Australians | 71.4 /100 | #152 | Good 12.6% |
| Immigrants | Immigrants | 70.1 /100 | #153 | Good 12.7% |
| Immigrants | Scotland | 68.9 /100 | #154 | Good 12.7% |
| Immigrants | Spain | 68.7 /100 | #155 | Good 12.7% |
| Vietnamese | 67.9 /100 | #156 | Good 12.7% |
| Latvians | 67.9 /100 | #157 | Good 12.7% |
| Immigrants | Middle Africa | 64.9 /100 | #158 | Good 12.7% |
| Immigrants | Liberia | 64.2 /100 | #159 | Good 12.7% |
| Greeks | 64.1 /100 | #160 | Good 12.7% |
| Immigrants | Africa | 63.4 /100 | #161 | Good 12.7% |
| Eastern Europeans | 63.3 /100 | #162 | Good 12.7% |
| Palestinians | 63.1 /100 | #163 | Good 12.7% |
Demographics Similar to Cheyenne by Single Male Poverty
In terms of single male poverty, the demographic groups most similar to Cheyenne are Alaskan Athabascan (16.1%, a difference of 0.040%), Dutch West Indian (16.1%, a difference of 0.14%), Cherokee (16.1%, a difference of 0.33%), Black/African American (16.2%, a difference of 0.48%), and Comanche (16.0%, a difference of 0.56%).
| Demographics | Rating | Rank | Single Male Poverty |
| Potawatomi | 0.0 /100 | #308 | Tragic 15.8% |
| Americans | 0.0 /100 | #309 | Tragic 15.8% |
| Yakama | 0.0 /100 | #310 | Tragic 15.9% |
| Seminole | 0.0 /100 | #311 | Tragic 16.0% |
| Comanche | 0.0 /100 | #312 | Tragic 16.0% |
| Cherokee | 0.0 /100 | #313 | Tragic 16.1% |
| Alaskan Athabascans | 0.0 /100 | #314 | Tragic 16.1% |
| Cheyenne | 0.0 /100 | #315 | Tragic 16.1% |
| Dutch West Indians | 0.0 /100 | #316 | Tragic 16.1% |
| Blacks/African Americans | 0.0 /100 | #317 | Tragic 16.2% |
| Chickasaw | 0.0 /100 | #318 | Tragic 16.3% |
| Chippewa | 0.0 /100 | #319 | Tragic 16.4% |
| Marshallese | 0.0 /100 | #320 | Tragic 16.4% |
| Osage | 0.0 /100 | #321 | Tragic 16.5% |
| Shoshone | 0.0 /100 | #322 | Tragic 16.7% |