Ute vs Immigrants from Belize Nursery School
COMPARE
Ute
Immigrants from Belize
Nursery School
Nursery School Comparison
Ute
Immigrants from Belize
98.2%
NURSERY SCHOOL
96.4/ 100
METRIC RATING
114th/ 347
METRIC RANK
96.9%
NURSERY SCHOOL
0.0/ 100
METRIC RATING
316th/ 347
METRIC RANK
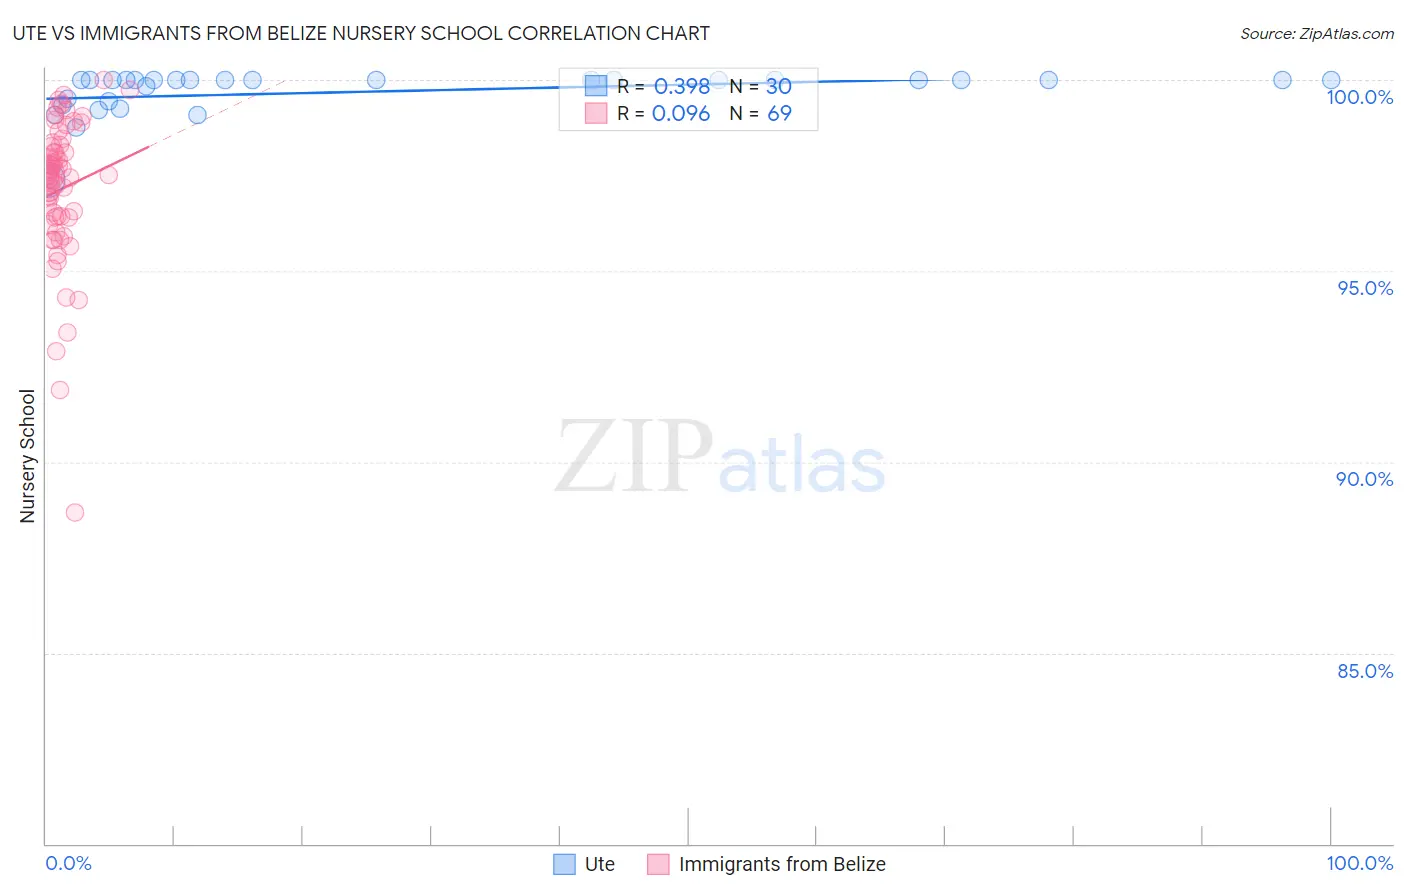
Ute vs Immigrants from Belize Nursery School Correlation Chart
The statistical analysis conducted on geographies consisting of 55,667,712 people shows a mild positive correlation between the proportion of Ute and percentage of population with at least nursery school education in the United States with a correlation coefficient (R) of 0.398 and weighted average of 98.2%. Similarly, the statistical analysis conducted on geographies consisting of 130,328,311 people shows a slight positive correlation between the proportion of Immigrants from Belize and percentage of population with at least nursery school education in the United States with a correlation coefficient (R) of 0.096 and weighted average of 96.9%, a difference of 1.3%.
Nursery School Correlation Summary
| Measurement | Ute | Immigrants from Belize |
| Minimum | 97.4% | 88.7% |
| Maximum | 100.0% | 100.0% |
| Range | 2.6% | 11.3% |
| Mean | 99.7% | 97.1% |
| Median | 100.0% | 97.5% |
| Interquartile 25% (IQ1) | 99.5% | 96.4% |
| Interquartile 75% (IQ3) | 100.0% | 98.3% |
| Interquartile Range (IQR) | 0.54% | 1.9% |
| Standard Deviation (Sample) | 0.57% | 1.9% |
| Standard Deviation (Population) | 0.56% | 1.9% |
Similar Demographics by Nursery School
Demographics Similar to Ute by Nursery School
In terms of nursery school, the demographic groups most similar to Ute are Immigrants from Latvia (98.2%, a difference of 0.0%), Iranian (98.2%, a difference of 0.0%), Immigrants from Singapore (98.2%, a difference of 0.010%), Immigrants from Czechoslovakia (98.2%, a difference of 0.010%), and Immigrants from Norway (98.2%, a difference of 0.010%).
| Demographics | Rating | Rank | Nursery School |
| Basques | 97.3 /100 | #107 | Exceptional 98.2% |
| Pima | 97.1 /100 | #108 | Exceptional 98.2% |
| German Russians | 97.1 /100 | #109 | Exceptional 98.2% |
| Immigrants | Singapore | 96.9 /100 | #110 | Exceptional 98.2% |
| Immigrants | Czechoslovakia | 96.8 /100 | #111 | Exceptional 98.2% |
| Immigrants | Norway | 96.6 /100 | #112 | Exceptional 98.2% |
| Immigrants | Latvia | 96.4 /100 | #113 | Exceptional 98.2% |
| Ute | 96.4 /100 | #114 | Exceptional 98.2% |
| Iranians | 96.3 /100 | #115 | Exceptional 98.2% |
| Spanish | 95.8 /100 | #116 | Exceptional 98.2% |
| Immigrants | France | 95.6 /100 | #117 | Exceptional 98.2% |
| Yugoslavians | 95.4 /100 | #118 | Exceptional 98.2% |
| Thais | 95.0 /100 | #119 | Exceptional 98.2% |
| Okinawans | 94.5 /100 | #120 | Exceptional 98.2% |
| Immigrants | Zimbabwe | 94.2 /100 | #121 | Exceptional 98.2% |
Demographics Similar to Immigrants from Belize by Nursery School
In terms of nursery school, the demographic groups most similar to Immigrants from Belize are Cape Verdean (97.0%, a difference of 0.0%), Immigrants from Nicaragua (96.9%, a difference of 0.0%), Honduran (97.0%, a difference of 0.010%), Immigrants from Ecuador (96.9%, a difference of 0.010%), and Guyanese (97.0%, a difference of 0.040%).
| Demographics | Rating | Rank | Nursery School |
| Immigrants | Somalia | 0.0 /100 | #309 | Tragic 97.0% |
| Guyanese | 0.0 /100 | #310 | Tragic 97.0% |
| Immigrants | Azores | 0.0 /100 | #311 | Tragic 97.0% |
| Sri Lankans | 0.0 /100 | #312 | Tragic 97.0% |
| Hondurans | 0.0 /100 | #313 | Tragic 97.0% |
| Cape Verdeans | 0.0 /100 | #314 | Tragic 97.0% |
| Immigrants | Nicaragua | 0.0 /100 | #315 | Tragic 96.9% |
| Immigrants | Belize | 0.0 /100 | #316 | Tragic 96.9% |
| Immigrants | Ecuador | 0.0 /100 | #317 | Tragic 96.9% |
| Immigrants | Guyana | 0.0 /100 | #318 | Tragic 96.9% |
| Immigrants | Laos | 0.0 /100 | #319 | Tragic 96.9% |
| Immigrants | Burma/Myanmar | 0.0 /100 | #320 | Tragic 96.9% |
| Immigrants | Bangladesh | 0.0 /100 | #321 | Tragic 96.9% |
| Mexican American Indians | 0.0 /100 | #322 | Tragic 96.9% |
| Immigrants | Honduras | 0.0 /100 | #323 | Tragic 96.9% |