Cheyenne vs Immigrants from Belize Single Father Poverty
COMPARE
Cheyenne
Immigrants from Belize
Single Father Poverty
Single Father Poverty Comparison
Cheyenne
Immigrants from Belize
16.7%
SINGLE FATHER POVERTY
9.3/ 100
METRIC RATING
217th/ 347
METRIC RANK
16.5%
SINGLE FATHER POVERTY
19.8/ 100
METRIC RATING
199th/ 347
METRIC RANK
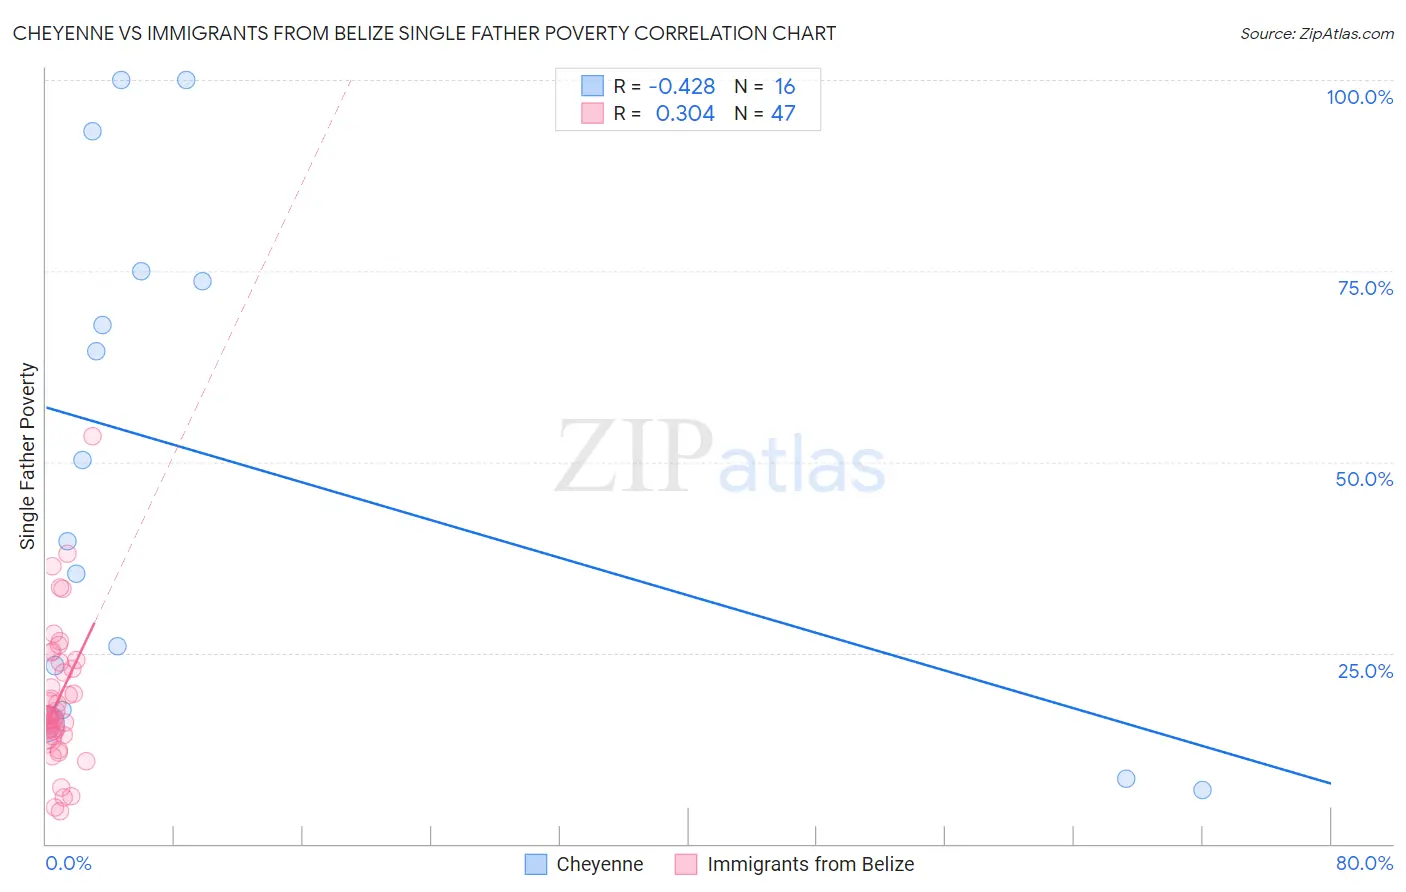
Cheyenne vs Immigrants from Belize Single Father Poverty Correlation Chart
The statistical analysis conducted on geographies consisting of 74,941,961 people shows a moderate negative correlation between the proportion of Cheyenne and poverty level among single fathers in the United States with a correlation coefficient (R) of -0.428 and weighted average of 16.7%. Similarly, the statistical analysis conducted on geographies consisting of 118,811,167 people shows a mild positive correlation between the proportion of Immigrants from Belize and poverty level among single fathers in the United States with a correlation coefficient (R) of 0.304 and weighted average of 16.5%, a difference of 0.95%.
Single Father Poverty Correlation Summary
| Measurement | Cheyenne | Immigrants from Belize |
| Minimum | 7.0% | 4.3% |
| Maximum | 100.0% | 53.3% |
| Range | 93.0% | 49.0% |
| Mean | 49.9% | 18.9% |
| Median | 45.0% | 16.7% |
| Interquartile 25% (IQ1) | 20.4% | 14.1% |
| Interquartile 75% (IQ3) | 74.3% | 23.7% |
| Interquartile Range (IQR) | 53.9% | 9.6% |
| Standard Deviation (Sample) | 32.7% | 9.2% |
| Standard Deviation (Population) | 31.6% | 9.1% |
Demographics Similar to Cheyenne and Immigrants from Belize by Single Father Poverty
In terms of single father poverty, the demographic groups most similar to Cheyenne are Immigrants from Scotland (16.7%, a difference of 0.030%), Immigrants from England (16.7%, a difference of 0.030%), Immigrants from Uganda (16.7%, a difference of 0.10%), Spanish (16.7%, a difference of 0.17%), and Ghanaian (16.7%, a difference of 0.20%). Similarly, the demographic groups most similar to Immigrants from Belize are Romanian (16.5%, a difference of 0.020%), Syrian (16.6%, a difference of 0.17%), Cuban (16.6%, a difference of 0.24%), Immigrants from Croatia (16.6%, a difference of 0.24%), and Immigrants from North America (16.6%, a difference of 0.36%).
| Demographics | Rating | Rank | Single Father Poverty |
| Romanians | 20.1 /100 | #198 | Fair 16.5% |
| Immigrants | Belize | 19.8 /100 | #199 | Poor 16.5% |
| Syrians | 17.4 /100 | #200 | Poor 16.6% |
| Cubans | 16.5 /100 | #201 | Poor 16.6% |
| Immigrants | Croatia | 16.5 /100 | #202 | Poor 16.6% |
| Immigrants | North America | 15.1 /100 | #203 | Poor 16.6% |
| Immigrants | Guatemala | 14.8 /100 | #204 | Poor 16.6% |
| Venezuelans | 14.3 /100 | #205 | Poor 16.6% |
| Immigrants | Senegal | 13.7 /100 | #206 | Poor 16.6% |
| New Zealanders | 13.7 /100 | #207 | Poor 16.6% |
| Eastern Europeans | 13.7 /100 | #208 | Poor 16.6% |
| Europeans | 13.2 /100 | #209 | Poor 16.6% |
| Guatemalans | 12.9 /100 | #210 | Poor 16.6% |
| Arabs | 12.8 /100 | #211 | Poor 16.6% |
| Immigrants | Southern Europe | 11.2 /100 | #212 | Poor 16.7% |
| Ghanaians | 11.0 /100 | #213 | Poor 16.7% |
| Spanish | 10.7 /100 | #214 | Poor 16.7% |
| Immigrants | Scotland | 9.6 /100 | #215 | Tragic 16.7% |
| Immigrants | England | 9.5 /100 | #216 | Tragic 16.7% |
| Cheyenne | 9.3 /100 | #217 | Tragic 16.7% |
| Immigrants | Uganda | 8.6 /100 | #218 | Tragic 16.7% |