Immigrants from Belize vs Hmong Single Male Poverty
COMPARE
Immigrants from Belize
Hmong
Single Male Poverty
Single Male Poverty Comparison
Immigrants from Belize
Hmong
13.7%
SINGLE MALE POVERTY
0.4/ 100
METRIC RATING
256th/ 347
METRIC RANK
14.2%
SINGLE MALE POVERTY
0.0/ 100
METRIC RATING
280th/ 347
METRIC RANK
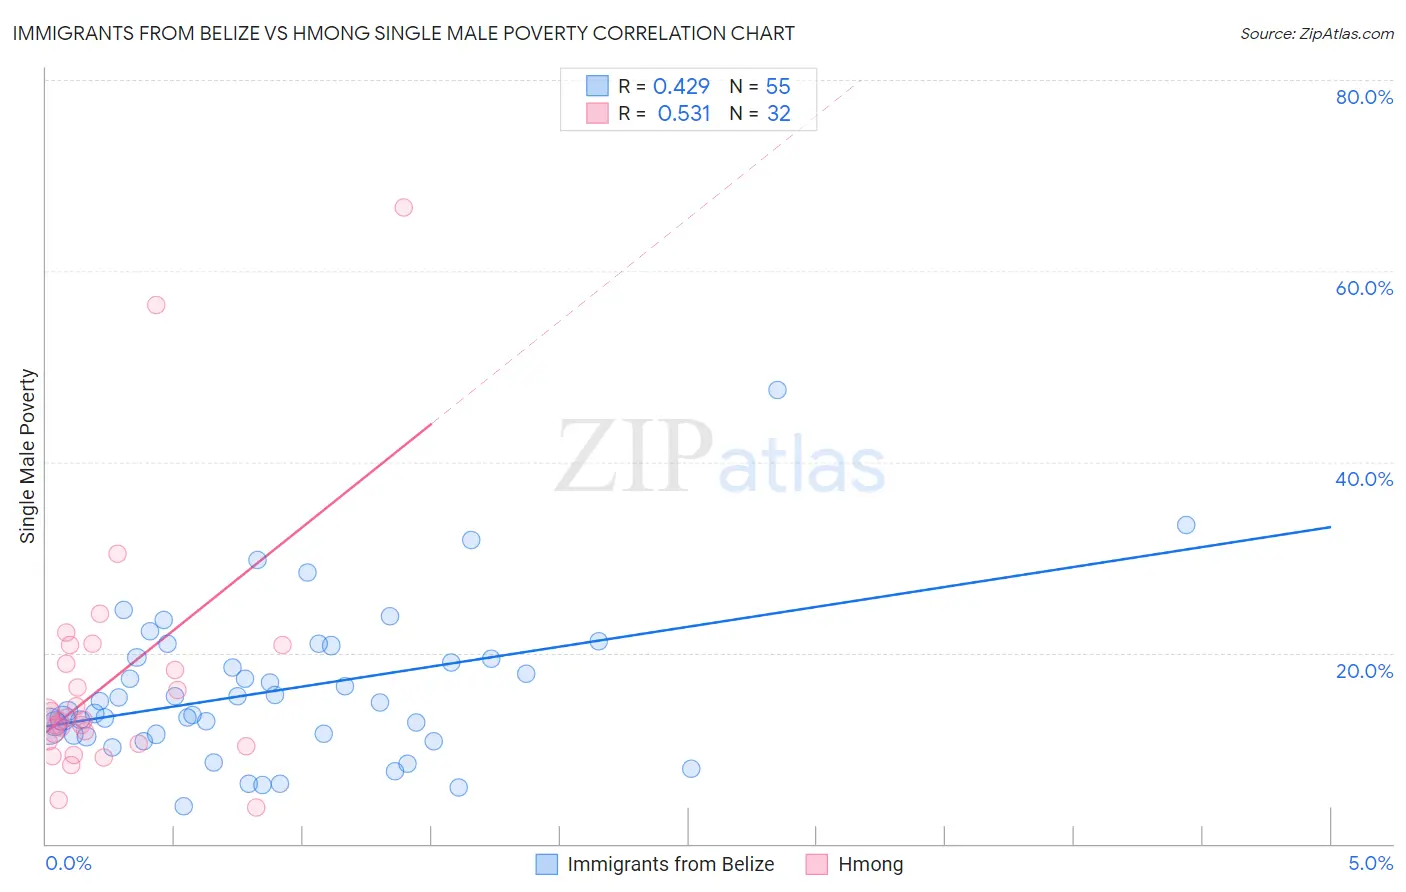
Immigrants from Belize vs Hmong Single Male Poverty Correlation Chart
The statistical analysis conducted on geographies consisting of 125,025,572 people shows a moderate positive correlation between the proportion of Immigrants from Belize and poverty level among single males in the United States with a correlation coefficient (R) of 0.429 and weighted average of 13.7%. Similarly, the statistical analysis conducted on geographies consisting of 24,410,058 people shows a substantial positive correlation between the proportion of Hmong and poverty level among single males in the United States with a correlation coefficient (R) of 0.531 and weighted average of 14.2%, a difference of 3.4%.
Single Male Poverty Correlation Summary
| Measurement | Immigrants from Belize | Hmong |
| Minimum | 4.0% | 3.8% |
| Maximum | 47.5% | 66.7% |
| Range | 43.5% | 62.9% |
| Mean | 16.1% | 17.1% |
| Median | 14.8% | 13.0% |
| Interquartile 25% (IQ1) | 11.5% | 10.6% |
| Interquartile 75% (IQ3) | 19.5% | 19.8% |
| Interquartile Range (IQR) | 8.0% | 9.2% |
| Standard Deviation (Sample) | 7.8% | 13.0% |
| Standard Deviation (Population) | 7.8% | 12.8% |
Similar Demographics by Single Male Poverty
Demographics Similar to Immigrants from Belize by Single Male Poverty
In terms of single male poverty, the demographic groups most similar to Immigrants from Belize are Spaniard (13.7%, a difference of 0.10%), Immigrants from Central America (13.8%, a difference of 0.18%), Subsaharan African (13.7%, a difference of 0.21%), Immigrants from Guatemala (13.8%, a difference of 0.25%), and Guatemalan (13.8%, a difference of 0.29%).
| Demographics | Rating | Rank | Single Male Poverty |
| Spanish | 1.0 /100 | #249 | Tragic 13.6% |
| Immigrants | Somalia | 1.0 /100 | #250 | Tragic 13.6% |
| Immigrants | Zaire | 0.9 /100 | #251 | Tragic 13.6% |
| Finns | 0.9 /100 | #252 | Tragic 13.6% |
| German Russians | 0.8 /100 | #253 | Tragic 13.6% |
| Sub-Saharan Africans | 0.5 /100 | #254 | Tragic 13.7% |
| Spaniards | 0.4 /100 | #255 | Tragic 13.7% |
| Immigrants | Belize | 0.4 /100 | #256 | Tragic 13.7% |
| Immigrants | Central America | 0.3 /100 | #257 | Tragic 13.8% |
| Immigrants | Guatemala | 0.3 /100 | #258 | Tragic 13.8% |
| Guatemalans | 0.3 /100 | #259 | Tragic 13.8% |
| Swiss | 0.3 /100 | #260 | Tragic 13.8% |
| Hungarians | 0.3 /100 | #261 | Tragic 13.8% |
| Fijians | 0.3 /100 | #262 | Tragic 13.8% |
| Cape Verdeans | 0.2 /100 | #263 | Tragic 13.8% |
Demographics Similar to Hmong by Single Male Poverty
In terms of single male poverty, the demographic groups most similar to Hmong are Hispanic or Latino (14.2%, a difference of 0.030%), Spanish American (14.2%, a difference of 0.18%), Yaqui (14.2%, a difference of 0.34%), Indonesian (14.1%, a difference of 0.70%), and Slovak (14.1%, a difference of 0.74%).
| Demographics | Rating | Rank | Single Male Poverty |
| Welsh | 0.1 /100 | #273 | Tragic 14.0% |
| Hondurans | 0.1 /100 | #274 | Tragic 14.0% |
| English | 0.1 /100 | #275 | Tragic 14.1% |
| Dutch | 0.1 /100 | #276 | Tragic 14.1% |
| Immigrants | Honduras | 0.0 /100 | #277 | Tragic 14.1% |
| Slovaks | 0.0 /100 | #278 | Tragic 14.1% |
| Indonesians | 0.0 /100 | #279 | Tragic 14.1% |
| Hmong | 0.0 /100 | #280 | Tragic 14.2% |
| Hispanics or Latinos | 0.0 /100 | #281 | Tragic 14.2% |
| Spanish Americans | 0.0 /100 | #282 | Tragic 14.2% |
| Yaqui | 0.0 /100 | #283 | Tragic 14.2% |
| Immigrants | Bahamas | 0.0 /100 | #284 | Tragic 14.4% |
| French | 0.0 /100 | #285 | Tragic 14.4% |
| Celtics | 0.0 /100 | #286 | Tragic 14.5% |
| Iroquois | 0.0 /100 | #287 | Tragic 14.5% |