U.S. Virgin Islander vs Sierra Leonean Child Poverty Among Girls Under 16
COMPARE
U.S. Virgin Islander
Sierra Leonean
Child Poverty Among Girls Under 16
Child Poverty Among Girls Under 16 Comparison
U.S. Virgin Islanders
Sierra Leoneans
22.1%
CHILD POVERTY AMONG GIRLS UNDER 16
0.0/ 100
METRIC RATING
319th/ 347
METRIC RANK
17.6%
CHILD POVERTY AMONG GIRLS UNDER 16
8.9/ 100
METRIC RATING
208th/ 347
METRIC RANK
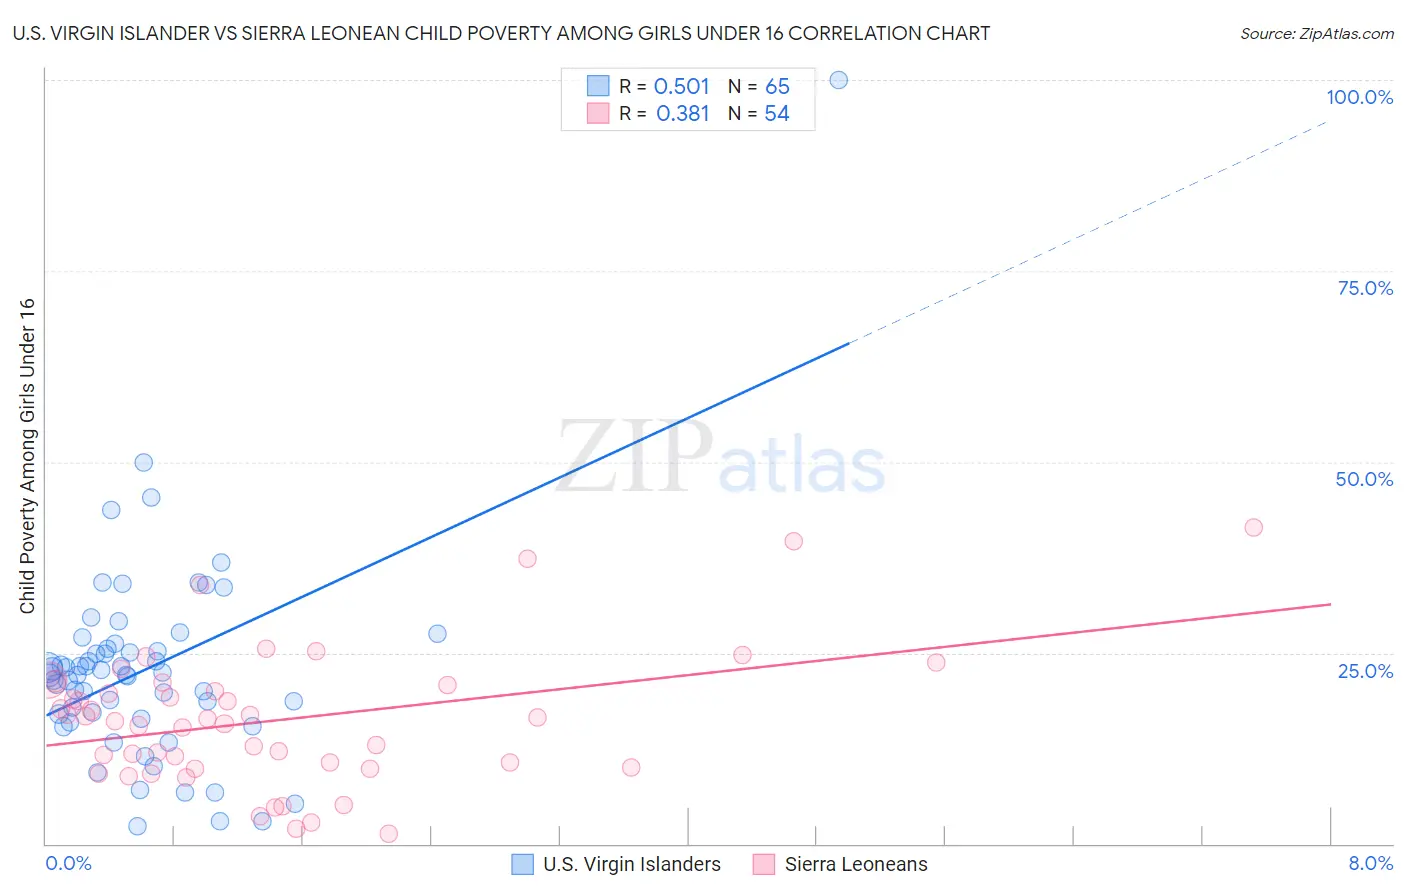
U.S. Virgin Islander vs Sierra Leonean Child Poverty Among Girls Under 16 Correlation Chart
The statistical analysis conducted on geographies consisting of 87,265,744 people shows a substantial positive correlation between the proportion of U.S. Virgin Islanders and poverty level among girls under the age of 16 in the United States with a correlation coefficient (R) of 0.501 and weighted average of 22.1%. Similarly, the statistical analysis conducted on geographies consisting of 83,143,649 people shows a mild positive correlation between the proportion of Sierra Leoneans and poverty level among girls under the age of 16 in the United States with a correlation coefficient (R) of 0.381 and weighted average of 17.6%, a difference of 25.8%.
Child Poverty Among Girls Under 16 Correlation Summary
| Measurement | U.S. Virgin Islander | Sierra Leonean |
| Minimum | 2.3% | 1.3% |
| Maximum | 100.0% | 41.4% |
| Range | 97.7% | 40.1% |
| Mean | 22.9% | 16.2% |
| Median | 22.1% | 16.2% |
| Interquartile 25% (IQ1) | 16.7% | 9.9% |
| Interquartile 75% (IQ3) | 25.9% | 20.7% |
| Interquartile Range (IQR) | 9.2% | 10.8% |
| Standard Deviation (Sample) | 13.7% | 8.9% |
| Standard Deviation (Population) | 13.6% | 8.8% |
Similar Demographics by Child Poverty Among Girls Under 16
Demographics Similar to U.S. Virgin Islanders by Child Poverty Among Girls Under 16
In terms of child poverty among girls under 16, the demographic groups most similar to U.S. Virgin Islanders are Immigrants from Dominica (22.1%, a difference of 0.16%), Honduran (22.2%, a difference of 0.60%), African (21.9%, a difference of 0.82%), Immigrants from Guatemala (21.9%, a difference of 1.1%), and Ute (21.8%, a difference of 1.4%).
| Demographics | Rating | Rank | Child Poverty Among Girls Under 16 |
| Immigrants | Mexico | 0.0 /100 | #312 | Tragic 21.6% |
| Creek | 0.0 /100 | #313 | Tragic 21.7% |
| Arapaho | 0.0 /100 | #314 | Tragic 21.7% |
| Ute | 0.0 /100 | #315 | Tragic 21.8% |
| Immigrants | Guatemala | 0.0 /100 | #316 | Tragic 21.9% |
| Africans | 0.0 /100 | #317 | Tragic 21.9% |
| Immigrants | Dominica | 0.0 /100 | #318 | Tragic 22.1% |
| U.S. Virgin Islanders | 0.0 /100 | #319 | Tragic 22.1% |
| Hondurans | 0.0 /100 | #320 | Tragic 22.2% |
| Colville | 0.0 /100 | #321 | Tragic 22.5% |
| Yakama | 0.0 /100 | #322 | Tragic 22.6% |
| Cajuns | 0.0 /100 | #323 | Tragic 22.6% |
| Paiute | 0.0 /100 | #324 | Tragic 22.6% |
| Immigrants | Congo | 0.0 /100 | #325 | Tragic 22.7% |
| Immigrants | Honduras | 0.0 /100 | #326 | Tragic 22.8% |
Demographics Similar to Sierra Leoneans by Child Poverty Among Girls Under 16
In terms of child poverty among girls under 16, the demographic groups most similar to Sierra Leoneans are Panamanian (17.6%, a difference of 0.070%), Hmong (17.5%, a difference of 0.53%), Immigrants (17.7%, a difference of 0.58%), Delaware (17.4%, a difference of 0.78%), and Immigrants from Eastern Africa (17.7%, a difference of 0.96%).
| Demographics | Rating | Rank | Child Poverty Among Girls Under 16 |
| Immigrants | Kenya | 17.8 /100 | #201 | Poor 17.2% |
| Immigrants | Sierra Leone | 17.6 /100 | #202 | Poor 17.2% |
| Ugandans | 17.5 /100 | #203 | Poor 17.2% |
| Iraqis | 13.0 /100 | #204 | Poor 17.4% |
| Immigrants | Cameroon | 12.6 /100 | #205 | Poor 17.4% |
| Delaware | 11.5 /100 | #206 | Poor 17.4% |
| Hmong | 10.6 /100 | #207 | Poor 17.5% |
| Sierra Leoneans | 8.9 /100 | #208 | Tragic 17.6% |
| Panamanians | 8.7 /100 | #209 | Tragic 17.6% |
| Immigrants | Immigrants | 7.3 /100 | #210 | Tragic 17.7% |
| Immigrants | Eastern Africa | 6.4 /100 | #211 | Tragic 17.7% |
| Immigrants | Thailand | 6.3 /100 | #212 | Tragic 17.7% |
| Pennsylvania Germans | 5.7 /100 | #213 | Tragic 17.8% |
| Malaysians | 5.7 /100 | #214 | Tragic 17.8% |
| German Russians | 5.7 /100 | #215 | Tragic 17.8% |